Photo: Wikipedia
Quality of Life in Middlesex County
A livable area that tracks near national norms for affordability, walkability, and neighborhood health.
What does Quality of Life tell us?
Quality of Life measures an area by evaluating factors like cost of living, nearby amenities, country club access, airport proximity, socioeconomic signals and neighborhood character. For large states, this is a general average — quality of life can vary dramatically between metro areas, suburbs, and rural communities within the same state.
What does this tell us?
Quality of Life measures an area by evaluating factors like cost of living, nearby amenities, country club access, airport proximity, socioeconomic signals and neighborhood character. For large states, this is a general average — quality of life can vary dramatically between metro areas, suburbs, and rural communities within the same state.
Cost of Living
107% above national average
65%
The Real Cost of Living in Middlesex County for 2026
| Tier | Individual | Family (4) |
|---|---|---|
| Survival | $34k | $64k |
| Comfortable | $134k | $196k |
| Luxury | $229k+ | $355k+ |
| Elite (Top 5%) | $280k+ | $434k+ |
Quality-of-Life Analysis
Middlesex County, Massachusetts, presents one of the most diverse quality-of-life spectrums in New England, ranging from the dense, transit-oriented urbanism of Cambridge and Lowell to the quiet, wooded subdivisions of towns like Carlisle and the agricultural remnants of places like Holliston. The county’s character shifts dramatically within a 20-mile drive, drawing professionals who want walkable city access, families seeking top-tier school districts, and those who desire a rural feel without leaving Greater Boston entirely. With a cost of living index of 207 (double the national average), a median home value of $687,200, and a median rent of $2,126, the trade-offs between space, commute time, and amenities are sharply defined by location.
Largest town(s) & population centers
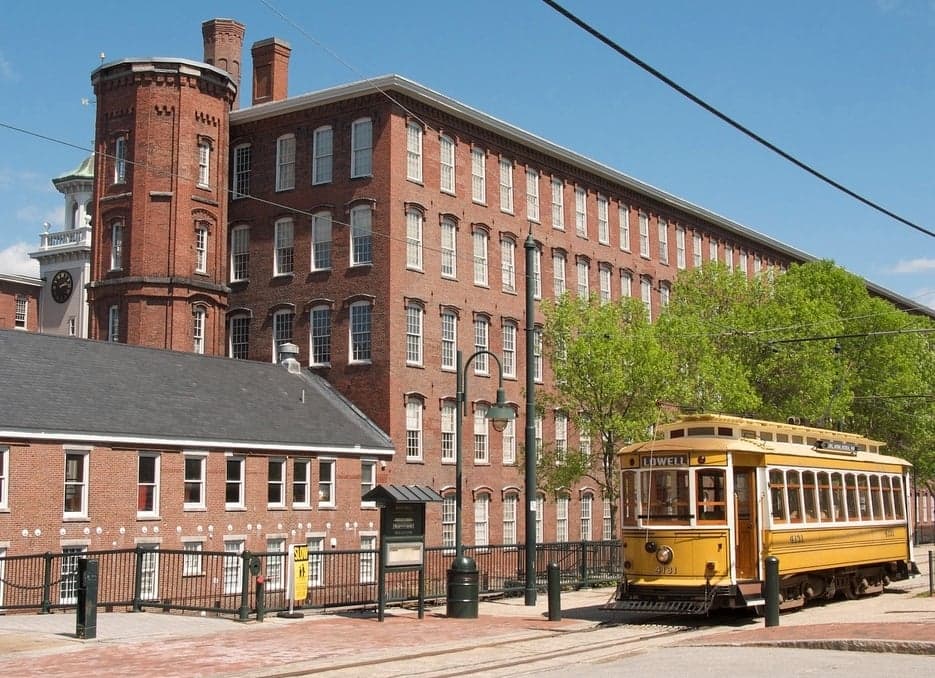
Cambridge is the county’s urban anchor, home to Harvard and MIT, with a dense, walkable core, a vibrant restaurant scene, and a Red Line subway connection to Boston. Daily life here is defined by high-rise apartments, bike lanes, and a median age skewed younger by students and tech workers. Lowell, the county seat, offers a more affordable urban experience with a historic mill district, a growing arts scene, and a diverse population; its commuter rail access to Boston (about 45 minutes) makes it a practical choice for those priced out of Cambridge. Newton and Framingham represent the suburban middle ground: Newton is a wealthy, top-ranked school district with a mix of single-family homes and T-access, while Framingham is more diverse and affordable, with a large Brazilian community and a slower commuter rail ride. The average commute across the county is 30 minutes, but residents of these population centers often face 40–60 minute door-to-door trips to downtown Boston.
Smaller towns & rural pockets
Middlesex County retains surprising rural character in its western and northern reaches. Carlisle, a town of about 5,000 residents, has no downtown, no traffic lights, and is largely composed of conservation land, horse farms, and large-lot homes—a deliberate escape from suburban density. Boxborough and Stow offer similar low-density living with access to the Assabet River Rail Trail and local orchards. Holliston and Hopkinton (the latter famous as the start of the Boston Marathon) feature historic village centers surrounded by woods and wetlands, with a mix of older colonials and new subdivisions. Ashby, at the county’s northern edge, is the most rural, with a population under 3,000 and a median home value well below the county average, though it lacks commuter rail service. These areas attract residents who prioritize land, quiet, and school systems like Carlisle Public Schools (consistently ranked among the state’s top) over urban convenience.
Cost & lifestyle range
The cost spread across Middlesex County is extreme. At the high end, Weston and Lexington have median home values exceeding $1.5 million, with property taxes to match, and offer elite public schools, large estates, and proximity to Route 128 employment hubs. Cambridge and Somerville command high prices for smaller spaces—a two-bedroom condo in Cambridge often rents for $3,500+—but provide walkability to jobs, culture, and transit. At the lower end, Lowell and Fitchburg (the latter partially in Worcester County) offer median home values closer to $400,000 and rents under $1,800, though with longer commutes and fewer local amenities. Framingham and Marlborough sit in the middle, with home values around $550,000–$600,000 and a mix of older housing stock and new developments. The lifestyle trade-off is clear: a $687,200 median home buys a 1,200-square-foot condo in Cambridge or a 2,500-square-foot colonial on an acre in Holliston.
Middlesex County best suits those who can clearly define their priorities—whether that is a zero-car urban lifestyle in Cambridge, a top-tier school district in Lexington, or a five-acre homestead in Carlisle. The county’s strength is its granularity: no single town defines the experience, and the range of options means that a family earning $150,000 and a dual-income tech couple earning $400,000 can both find a place that fits, provided they are willing to accept the corresponding commute or space trade-off. Those seeking a true rural lifestyle at a lower cost may find better value in neighboring Worcester County, but for anyone who needs to remain within striking distance of Boston’s job market while choosing their preferred density, Middlesex County offers the most complete spectrum in Massachusetts.

Crime in Middlesex County
Generally safer than 71% of comparable U.S. locations.
Violent CrimeViolent Crime Analysis
Property CrimeProperty Crime Analysis
Crime Analysis
Middlesex County, Massachusetts, presents a mixed safety profile that is heavily shaped by its urban centers and progressive judicial policies. With a violent crime rate of 235.8 per 100,000 residents and a property crime rate of 993.9 per 100,000, the county is statistically safer than the national average but faces significant challenges in its larger cities. The overall picture is one of stark contrast: affluent, suburban communities enjoy very low crime rates, while dense, transit-oriented cities struggle with higher incidents, a divide that is exacerbated by the region's liberal approach to criminal justice.
Crime in context
Middlesex County's violent crime rate of 235.8 per 100,000 is notably lower than the national average of approximately 380 per 100,000, but it is higher than the Massachusetts state average of roughly 300 per 100,000. The property crime rate of 993.9 per 100,000 is also below the national figure of about 1,950 per 100,000, but it is elevated compared to many other suburban counties in New England. These numbers are pulled upward by the county's largest cities, particularly Lowell and Cambridge, which report violent crime rates well above the county average. In contrast, communities like Lexington, Weston, and Concord consistently report violent crime rates below 50 per 100,000, creating a dramatic safety gap within the same county. The presence of progressive district attorneys in Middlesex County, who often prioritize diversion programs and reduced sentencing for non-violent offenders, has been cited by critics as a factor that may embolden repeat offenders and undermine public confidence in the justice system.
What residents experience
For the average resident, the experience of crime in Middlesex County depends heavily on where they live and commute. In cities like Lowell and Malden, property crime—including larceny, motor vehicle theft, and burglary—is a daily concern, with rates often exceeding 1,500 per 100,000. These areas also see higher rates of drug-related offenses and assaults, which are frequently linked to the opioid crisis that has hit Massachusetts hard. In suburban towns like Newton and Arlington, residents are more likely to experience package thefts or occasional break-ins, but violent crime is rare. The county's progressive judicial policies, including cash bail reform and the decriminalization of certain low-level offenses, have been praised by advocates for reducing incarceration rates but criticized by residents who feel that repeat property offenders are cycled back onto the streets too quickly. This tension is most acute in the urban centers, where residents report feeling less safe than they did a decade ago, despite official statistics showing a long-term decline in violent crime.
Neighborhood-level variation
Neighborhood-level safety in Middlesex County is highly granular, with sharp divides often occurring along municipal lines and even within individual cities. In Cambridge, for example, the area around Harvard Square and the Brattle Street historic district is among the safest in the county, while the Port neighborhood and parts of Central Square experience higher rates of robbery and aggravated assault. Similarly, Lowell's downtown and the Acre neighborhood see elevated crime, while the Belvidere and Highlands sections are much quieter. The county's wealthier suburbs—Sudbury, Wayland, and Bedford—maintain near-zero violent crime rates and property crime rates well below 500 per 100,000, making them attractive to families and professionals. However, the progressive policies of the Middlesex District Attorney's office, which covers all of these communities, mean that even in safer towns, residents may be concerned about the broader regional approach to crime. The lack of a more punitive stance in the judicial system is a recurring point of debate, particularly among those who feel that the county's liberal ideology prioritizes offender rehabilitation over victim protection and public safety.
* Values derived from national, state, county, city and local statistics and may differ in a specific area. Last updated: 2026-07-03T03:30:06.000Z
Narrative content on this page is AI-generated and may contain mistakes. Verify any details that matter before acting on them.
ReloMaps may earn a commission from affiliate links at no extra cost to you.

