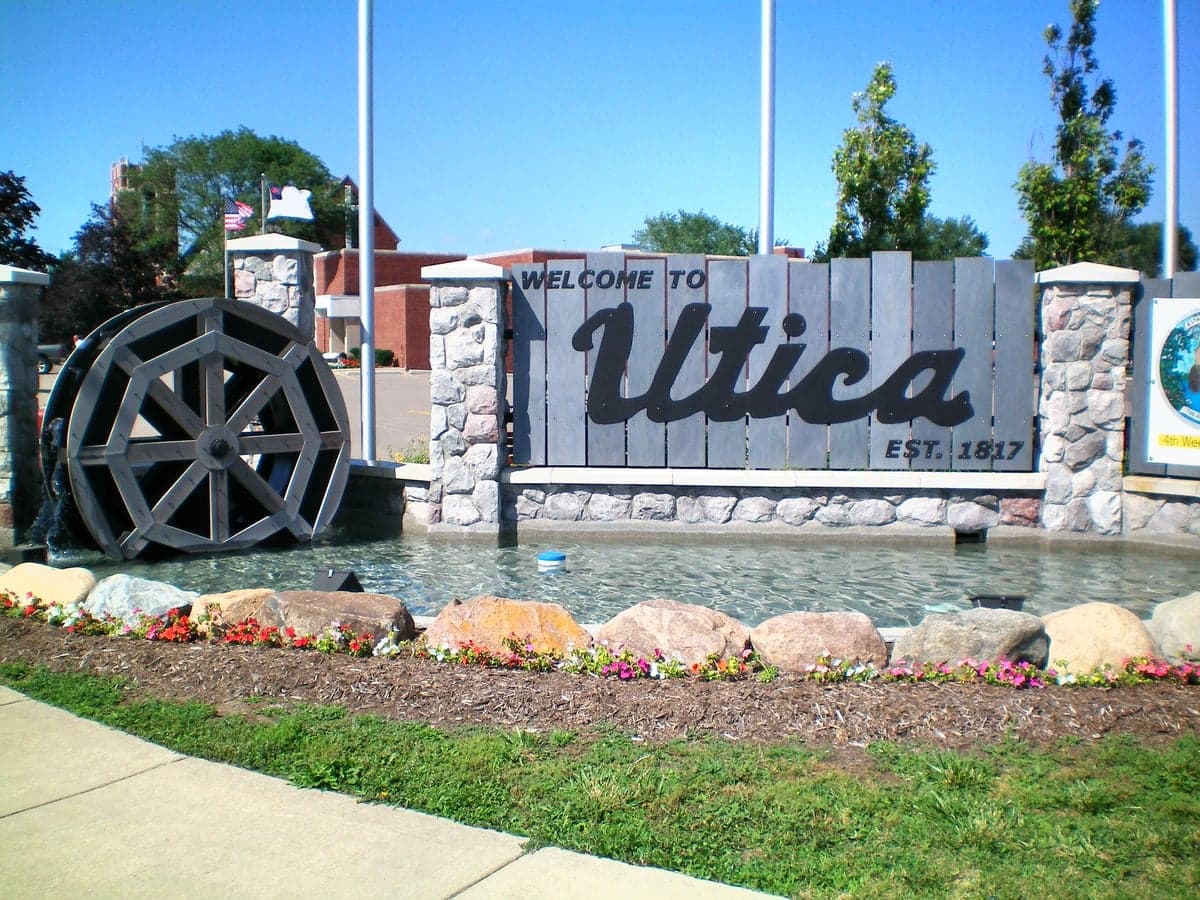
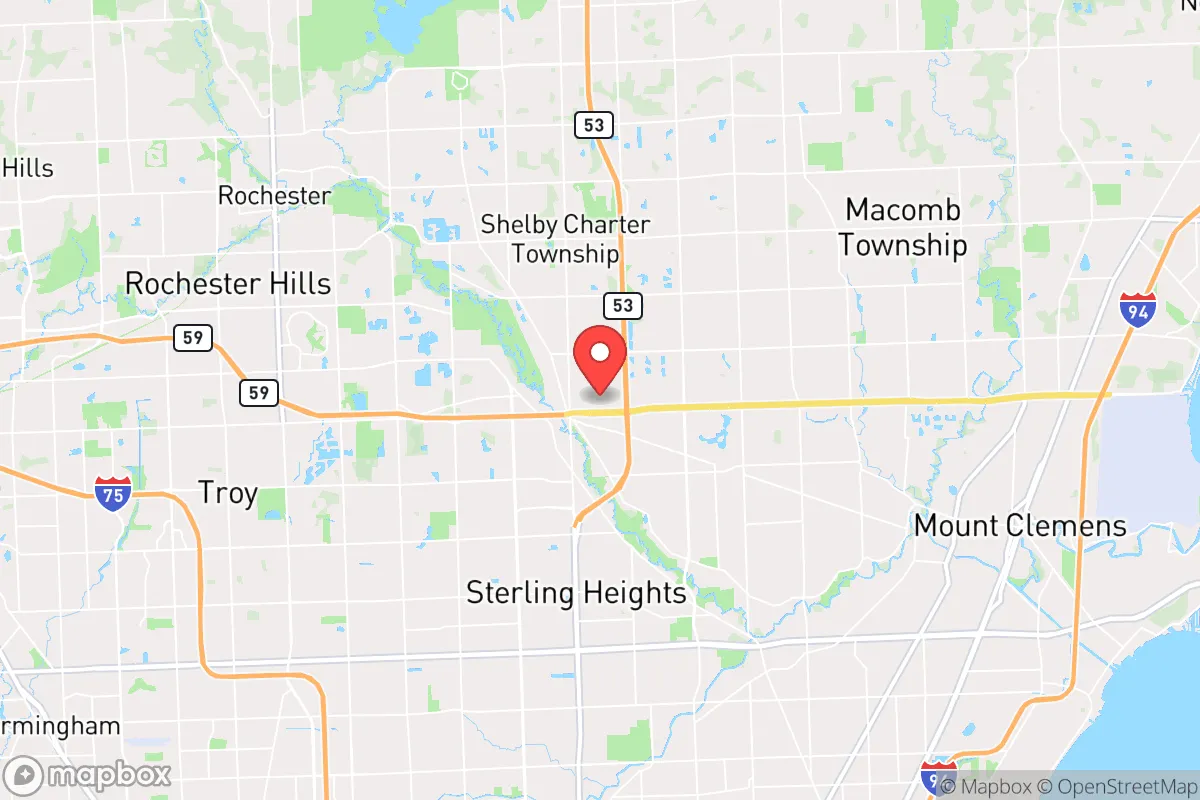
Photo: Wikipedia
Demographics of Utica, MI
Affluence Level in Utica, MI
A middle-class area roughly in line with national averages across income, home values, education, and employment.
People of Utica, MI
The people of Utica, Michigan today form a small, predominantly white community of 5,184 residents that retains a distinct small-town character despite being enveloped by suburban Macomb County. The city’s population density is moderate, with a mix of single-family homes and older housing stock, and its identity is shaped by a history of European settlement and recent modest diversification. Utica is notably less diverse than surrounding communities like Sterling Heights or Troy, with a foreign-born population of just 2.9% and a college attainment rate of 28.7%, reflecting a working-to-middle-class base that values local schools and a quieter pace of life.
How the city was settled and grew
Utica’s founding population arrived in the 1820s and 1830s, drawn by the fertile land along the Clinton River and the promise of water-powered mills. The first permanent settlers were primarily Yankee migrants from New York and New England, who established farms and a small village centered around what is now the Utica Historic District along Cass Avenue and Main Street. By the mid-19th century, German immigrants began arriving, settling in the area around Dodge Park and the eastern edge of the city, where they worked as farmers and mill laborers. A smaller wave of Polish immigrants followed in the early 1900s, clustering near the railroad corridor in the South Utica neighborhood, where St. Lawrence Catholic Church became a community anchor. The city incorporated in 1838 and remained a modest agricultural and milling hub through the early 20th century, with population growth slow and steady—never exceeding 1,000 residents until after World War II.
Modern era (post-1965)
The post-1965 period brought suburbanization as Detroit’s auto industry expanded, drawing new residents to Macomb County. Utica’s population peaked at around 5,000 in the 1970s and has since stabilized. The city saw an influx of second- and third-generation Italian and Polish families from Detroit’s northeast side, who moved into the North Utica and West Utica neighborhoods, attracted by affordable ranch homes and proximity to the M-59 corridor. Unlike nearby Sterling Heights or Troy, Utica did not experience large-scale immigration from Asia or the Middle East during this period. The 2024 data shows a white population of 80.7%, with the largest minority group being Indian (subcontinent) at 4.9%, followed by Hispanic (5.6%) and Black (3.8%). The Indian community is a relatively recent addition, concentrated in newer subdivisions near Hall Road (M-59) on the city’s northern fringe, where professionals working in healthcare and engineering have settled. East/Southeast Asian residents remain a very small share at 0.4%, with no distinct neighborhood concentration.
The future
Utica’s population is projected to remain stable or decline slightly over the next decade, as the city is largely built out with limited vacant land for new development. The white share is expected to continue a gradual decline, while the Hispanic and Indian populations are likely to grow modestly, driven by younger families seeking affordable housing in Macomb County. The Hall Road corridor will likely absorb most new residents, as it offers newer construction and access to retail and employment centers. The city’s cultural identity is slowly shifting from a historically homogeneous, European-heritage community to a more diverse but still predominantly white suburb. For someone moving in now, Utica offers a stable, low-crime environment with a strong sense of local history, but those seeking significant ethnic diversity or a rapidly changing demographic landscape will find it in neighboring Sterling Heights or Troy rather than Utica itself.
Utica is becoming a quieter, older suburb where long-term residents and a small but growing number of Indian and Hispanic families coexist. Its future is one of slow, incremental change rather than transformation, making it a fit for those who value stability, local schools, and a close-knit community over urban amenities or rapid growth.

* Values derived from national, state, county, city and local statistics and may differ in a specific area. Last updated: 2026-10-05T07:45:18.000Z
Narrative content on this page is AI-generated and may contain mistakes. Verify any details that matter before acting on them.
ReloMaps may earn a commission from affiliate links at no extra cost to you.

