Photo: Wikipedia
Demographics of New Hanover County
Affluence Level in New Hanover County
A middle-class area roughly in line with national averages across income, home values, education, and employment.
People of New Hanover County
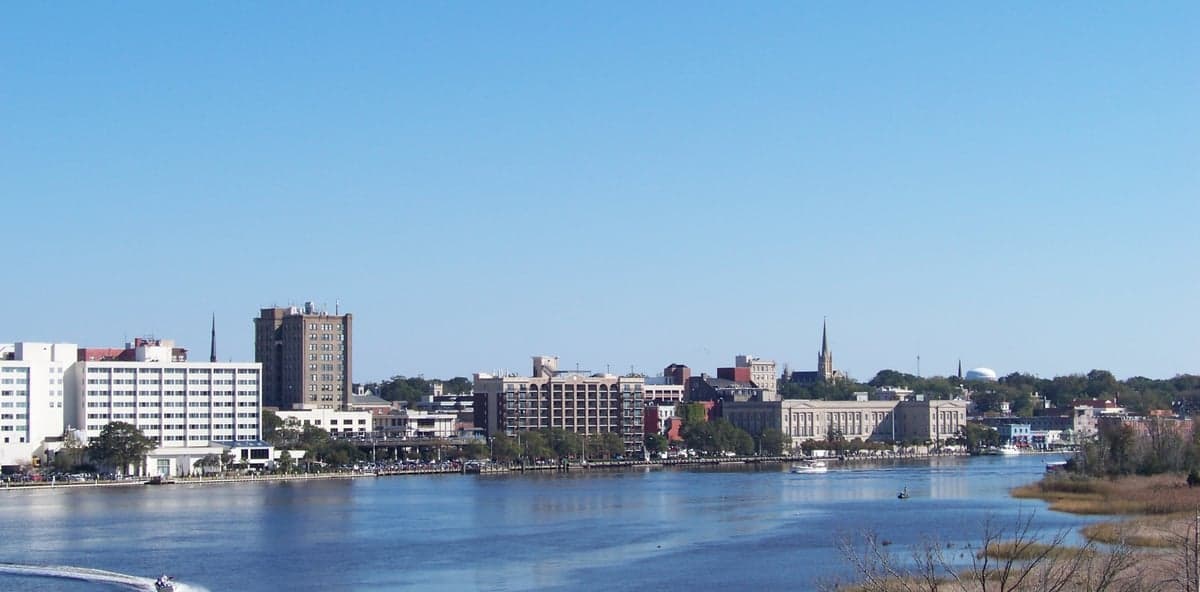
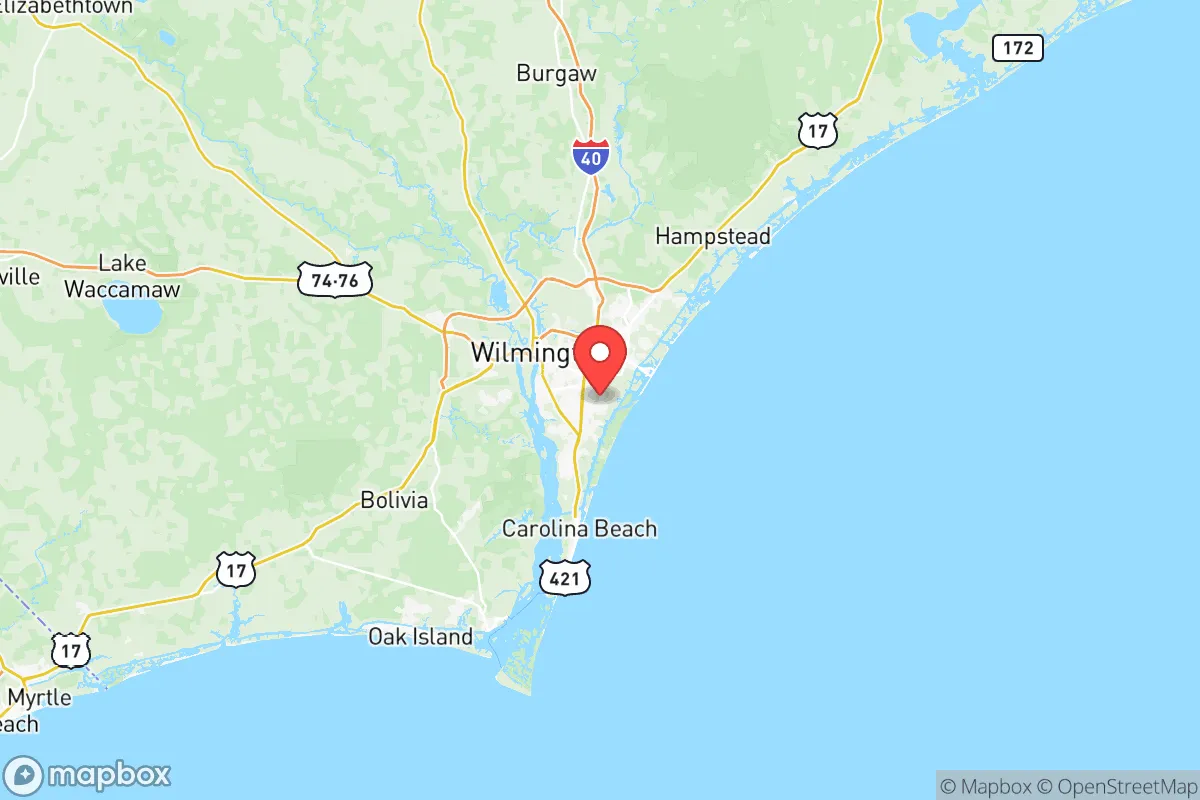
Today, New Hanover County is home to 231,214 residents, a predominantly white (75.1%) and college-educated (44.8%) population that gives the area a character distinct from the rest of southeastern North Carolina. The county’s identity is shaped by its historic port city of Wilmington, a growing suburban corridor along the US-17 and I-140 bypass, and a string of beach communities—Carolina Beach, Kure Beach, and Wrightsville Beach—that draw both tourists and permanent residents. While the population is less diverse than the state average, with a foreign-born share of just 3.5%, the county has seen steady Hispanic and Asian growth since 2000, and its political and cultural leanings remain a blend of traditional Southern conservatism and coastal libertarianism.
Settlement & growth (pre-1960)
Long before European arrival, the region that is now New Hanover County was inhabited by the Cape Fear Indians, a Siouan-speaking people who lived along the Cape Fear River. By the early 1700s, disease and displacement had largely emptied the area, and the first permanent European settlers—primarily English and Scots-Irish farmers—arrived from the Albemarle region and coastal Virginia. The town of Wilmington was established in 1739 at the confluence of the Cape Fear River and its tributaries, quickly becoming a major port for naval stores, lumber, and rice. The county itself was formed in 1729 from Craven County and named for the House of Hanover, reflecting the area's early English colonial character.
Through the 18th and 19th centuries, Wilmington grew as a commercial hub, attracting a mix of merchants, shipbuilders, and enslaved Africans who formed the backbone of the region's plantation economy. By 1860, roughly half of New Hanover County's population was enslaved, and Wilmington had one of the largest free Black communities in the South. After the Civil War, the port declined, but the city remained a regional center for rail and trade. The 1898 Wilmington insurrection—a violent coup by white supremacists that overthrew the elected biracial government—drove thousands of Black residents from the city and reshaped the county's demographics for decades. Into the early 20th century, the population remained overwhelmingly native-born white and Black, with little foreign immigration compared to Northern industrial cities.
World War II brought a major shift. The U.S. Army built Camp Davis near Holly Ridge (just north of the county line) and the North Carolina Shipbuilding Company in Wilmington, drawing thousands of workers from across the rural South. After the war, many of those workers stayed, and the county began its transition from a sleepy port town to a Sun Belt destination. Suburban development pushed south and east of Wilmington, with new neighborhoods spreading toward the beaches. The completion of the Intracoastal Waterway and the growth of the University of North Carolina Wilmington (founded in 1947) laid the groundwork for the modern, service-oriented economy that would define the county after 1960.
Modern era (post-1965)
The 1965 Hart-Cellar Act had a modest direct effect on New Hanover County compared to major gateway cities, but its long-term impact is visible in the slow diversification of the population. The foreign-born share remains low at 3.5%, but that figure has doubled since 2000. The largest immigrant groups today are Hispanic (primarily from Mexico and Central America) and East/Southeast Asian (Vietnamese, Filipino, and Chinese), with a very small Indian-subcontinent population (0.1%). Hispanic residents now make up 7.6% of the county, up from roughly 3% in 2000, and are concentrated in southern Wilmington and the unincorporated areas around Castle Hayne and Leland (just across the river in Brunswick County).
Domestic migration has been the far larger force reshaping the county. Since the 1970s, New Hanover has attracted retirees, remote workers, and families from the Northeast and Midwest, drawn by the mild climate, lower cost of living, and coastal lifestyle. The county's population grew by 25% between 2000 and 2010 and by another 15% between 2010 and 2020. Much of this growth has concentrated in the suburban towns of Leland (technically in Brunswick County but part of the Wilmington metro), Ogden, and the Landfall community near Wrightsville Beach. The Black population share has declined from roughly 18% in 1990 to 11.1% today, as new white in-migration has outpaced growth in the historic Black community, which remains centered in northern Wilmington and the 28401 and 28403 zip codes.
Suburbanization has been the dominant geographic trend. The construction of the I-140 bypass in the 2000s opened large tracts of land in the northern part of the county for residential development, creating a commuter belt that stretches from Porters Neck to the Pender County line. The beach towns—Carolina Beach, Kure Beach, and Wrightsville Beach—have shifted from seasonal vacation spots to year-round communities, with rising home prices pushing younger families inland toward Castle Hayne and the Murrayville area. The county's college-educated share (44.8%) is well above the national average, reflecting the presence of UNCW, the medical sector (New Hanover Regional Medical Center), and the influx of professionals from outside the region.
The future
New Hanover County is projected to continue growing at a steady pace, with the population expected to reach roughly 275,000 by 2040. The county is becoming slightly more diverse, driven primarily by Hispanic growth and a smaller but steady increase in East/Southeast Asian residents. The white share, while still dominant, is likely to decline gradually from its current 75.1% as younger, more diverse families move into the suburban fringe and as the existing Hispanic population ages into childbearing years. The Indian-subcontinent population is expected to remain very small, as the county lacks the tech and engineering job base that draws that group to the Raleigh-Durham area.
The biggest demographic question is housing affordability. As coastal property values rise, younger families and service workers are being pushed north toward Castle Hayne and Rocky Point (in Pender County) and west across the Cape Fear River into Brunswick County. This dispersal is likely to continue, making the Wilmington metro area more regionally integrated but potentially diluting the county's tax base and cultural identity. The county's political character—historically conservative but with a growing Democratic-leaning urban core in Wilmington—will likely remain competitive, with the suburban and exurban areas leaning Republican and the city center trending left.
For someone moving to New Hanover County now, the area offers a mix of historic coastal charm and modern suburban convenience, with a population that is whiter, older, and more educated than the state average. The county is not becoming a diverse melting pot in the manner of Charlotte or Raleigh, but it is slowly opening to new groups, particularly Hispanic families and East/Southeast Asian professionals. The key trend to watch is the outward spread of development: the next decade will determine whether the county can manage growth without losing the character that drew people here in the first place.

* Values derived from national, state, county, city and local statistics and may differ in a specific area. Last updated: 2026-07-02T17:24:37.000Z
Narrative content on this page is AI-generated and may contain mistakes. Verify any details that matter before acting on them.
ReloMaps may earn a commission from affiliate links at no extra cost to you.

