Photo: Wikipedia
Demographics of Eureka, CA
Affluence Level in Eureka, CA
A middle-class area roughly in line with national averages across income, home values, education, and employment.
People of Eureka, CA
Eureka, California, is home to roughly 26,300 residents, a majority-white population (65.5%) with a notable Hispanic community (14.2%) and a smaller East and Southeast Asian presence (5.3%). The city’s identity is rooted in its maritime and timber history, with a working-class character that remains visible in its Victorian-era neighborhoods and active fishing harbor. Foreign-born residents make up just 3.6% of the population, and 31.3% of adults hold a college degree, reflecting a community that is more blue-collar and locally rooted than the broader California average.
How the city was settled and grew
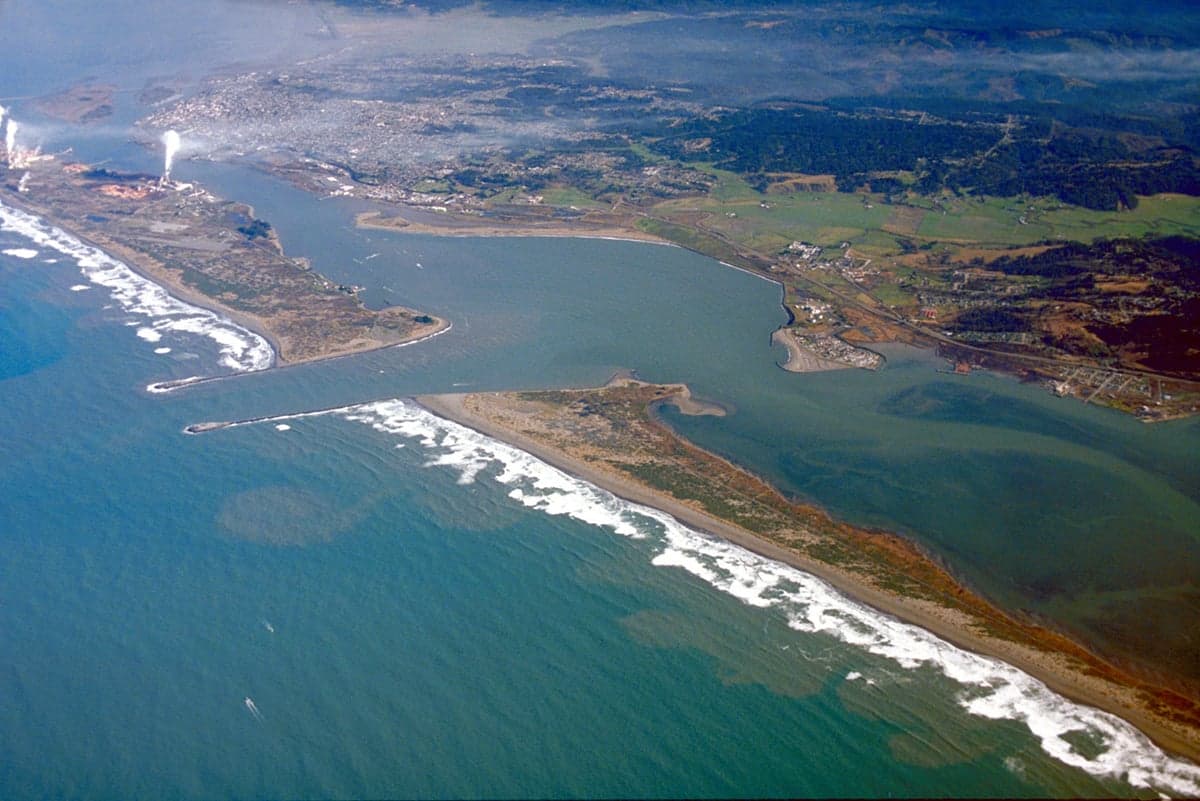
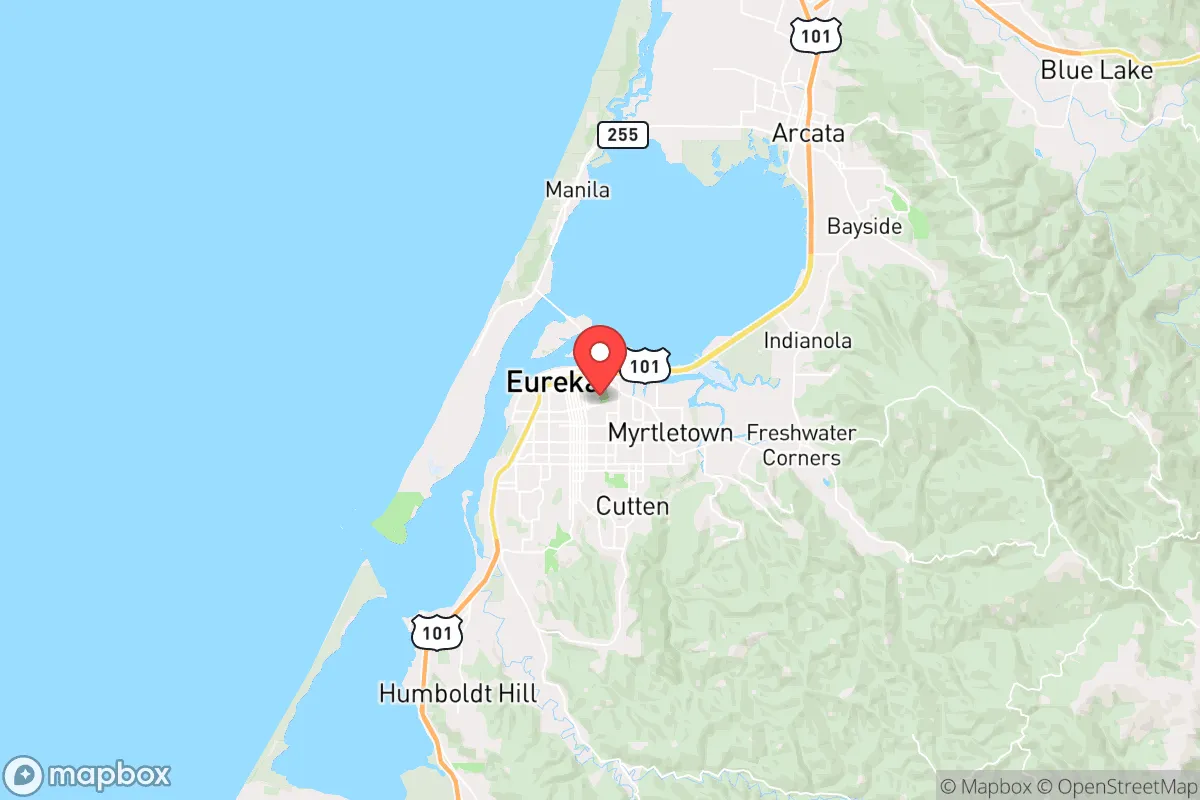
Eureka was founded in 1850 during the California Gold Rush, but its lasting growth came not from gold but from timber and the sea. The city’s deep-water harbor made it a natural shipping point for redwood lumber, and by the 1880s it was one of the busiest ports on the West Coast. The original population was overwhelmingly white and American-born, drawn from the East Coast and Midwest by the promise of mill work and maritime jobs. The first significant wave of immigrants were European — primarily Irish, Italian, and Portuguese — who settled in the working-class districts near the waterfront, particularly Humboldt Hill and the Eureka Slough area, where fishing and milling families clustered. The city’s most iconic neighborhood, Old Town, was built by these early merchants and mill owners, and its ornate Victorian storefronts still anchor the downtown today.
By the early 20th century, the city’s population was almost entirely white, with a small but established Chinese community that had arrived during the railroad era. This community concentrated along the waterfront near Samoa Boulevard, though it was largely dispersed by the 1920s due to exclusionary laws. The timber boom of the 1940s and 1950s brought a second wave of domestic migrants — white families from the Dust Bowl states and the Pacific Northwest — who settled in the newer, flatter neighborhoods like Cutten and Pine Hill, where post-war tract housing was built to accommodate the growing mill workforce.
Modern era (post-1965)
The post-1965 era brought a slow but measurable diversification to Eureka, though the city remains far less diverse than California as a whole. The most significant shift has been the growth of the Hispanic population, which now stands at 14.2%. This community is largely composed of Mexican-American families, many of whom arrived in the 1980s and 1990s to work in the region’s agriculture, fishing, and service industries. They have concentrated in the Humboldt Hill and Cutten areas, where affordable housing and proximity to the region’s farms made settlement practical. The East and Southeast Asian population (5.3%) is a smaller but established presence, with Filipino and Vietnamese families concentrated near the Old Town waterfront and the Eureka Slough — a legacy of the fishing industry that has long employed Asian-American crews.
The Black population (2.2%) and Indian-subcontinent population (0.3%) are both small, reflecting the city’s historical isolation and limited economic draw for these groups. The college-educated share (31.3%) has grown in recent decades, driven by the presence of Cal Poly Humboldt in nearby Arcata and the expansion of healthcare and education jobs in the region. This has brought a modest influx of white-collar professionals, many of whom have settled in the more desirable hillside neighborhoods like Pine Hill and the newer developments on the city’s eastern edge.
The future
Eureka’s population is aging and growing slowly, with the city’s total population having remained roughly flat over the past two decades. The Hispanic share is expected to continue its gradual rise, as it is the youngest demographic cohort in the city, while the white population is aging and shrinking in relative terms. The East and Southeast Asian community is stable but not growing significantly, and the Black and Indian-subcontinent populations are likely to remain very small given the region’s limited economic opportunities and geographic isolation.
The most notable demographic trend is the continued in-migration of remote workers and retirees drawn by the region’s natural beauty and lower cost of living compared to the Bay Area. This group is predominantly white and college-educated, and they are concentrating in the Pine Hill and Cutten neighborhoods, where newer housing stock and better internet access make remote work feasible. This is gradually shifting Eureka’s cultural identity from a struggling timber town to a more service-oriented, amenity-driven community, though the pace of change is slow.
For someone moving to Eureka today, the city offers a stable, majority-white, working-class community with a growing Hispanic presence and a small but established Asian-American population. The demographic trajectory is one of slow diversification, driven primarily by Hispanic growth and white-collar in-migration, but the city is unlikely to become a major immigrant destination. New arrivals will find a community that values its maritime and timber heritage, where neighborhoods like Old Town and Cutten retain distinct identities, and where the cost of living and pace of life remain markedly different from the rest of California.

* Values derived from national, state, county, city and local statistics and may differ in a specific area. Last updated: 2026-10-29T07:36:53.000Z
Narrative content on this page is AI-generated and may contain mistakes. Verify any details that matter before acting on them.
ReloMaps may earn a commission from affiliate links at no extra cost to you.

