
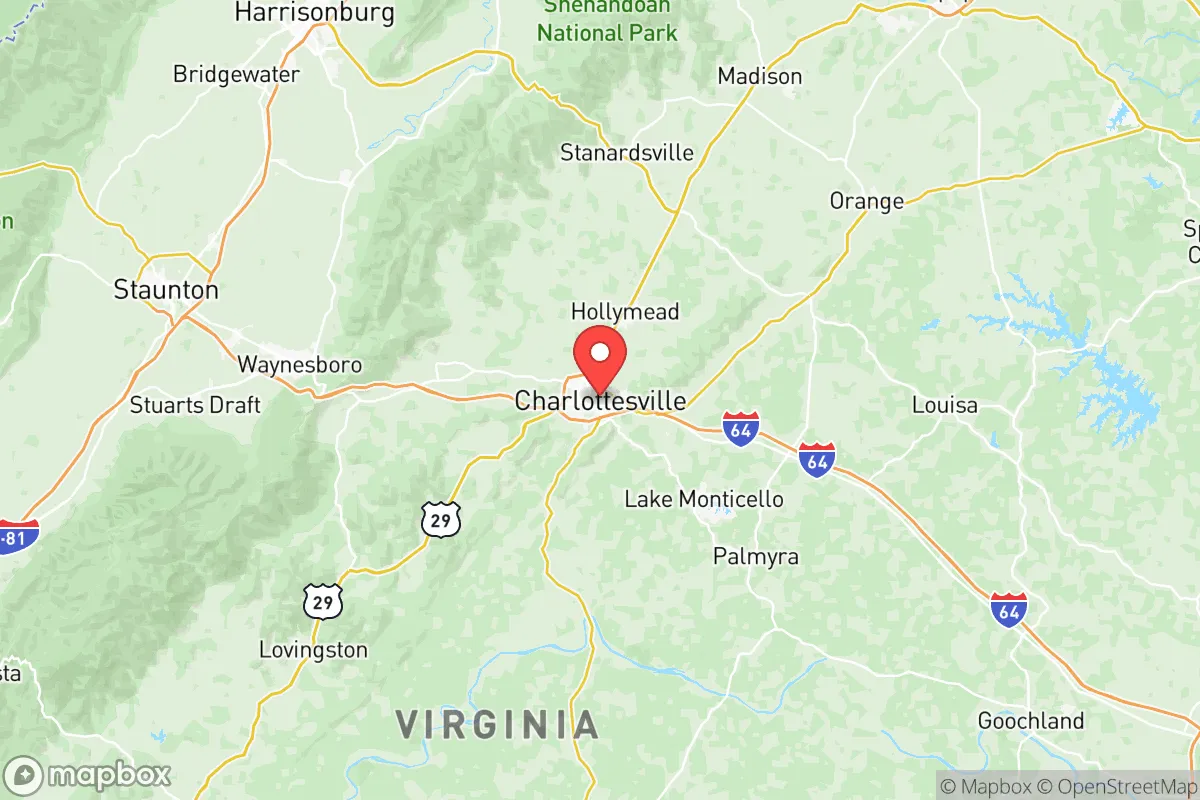
Demographics of Charlottesville City County
Affluence Level in Charlottesville City County
A middle-class area roughly in line with national averages across income, home values, education, and employment.
People of Charlottesville City County
Charlottesville City County, Virginia, is a compact, densely populated urban center of 45,863 residents, defined by its role as a university town and regional hub. The population is predominantly White (64.4%) with a significant Black community (16.8%), a growing Hispanic presence (6.8%), and notable East/Southeast Asian (5.4%) and Indian (1.6%) populations. With 60.6% of adults holding a college degree—more than double the national average—the city’s identity is shaped by the University of Virginia, a history of progressive activism, and a tension between its historic Southern roots and its modern, highly educated character.
Settlement & growth (pre-1960)
Before European settlement, the area now known as Charlottesville City County was part of the homeland of the Monacan Indian Nation, a Siouan-speaking people who lived in villages along the Rivanna River. The Monacans were largely displaced or absorbed by the mid-18th century as English colonists pushed westward from the Tidewater region. The Virginia General Assembly established the town of Charlottesville in 1762, named after Queen Charlotte, and it was incorporated as a city in 1888, later becoming an independent city—functionally a county-equivalent—separate from surrounding Albemarle County.
The first major wave of settlers were English and Scots-Irish farmers who arrived in the mid-1700s, drawn by the fertile Piedmont soil and land grants from the Crown. These families established plantations and small farms, with the city itself growing slowly as a market and government center. Thomas Jefferson, born nearby at Shadwell, founded the University of Virginia in 1819, which became the city’s defining institution. The university attracted a mix of wealthy Southern planters’ sons, faculty from the Northeast and Europe, and enslaved African Americans who built and maintained the campus. By 1860, enslaved people made up roughly half of Albemarle County’s population, and the city of Charlottesville was a hub for the domestic slave trade, with auctions held at the courthouse and local hotels.
After the Civil War, freed African Americans established communities within the city, notably in the Vinegar Hill neighborhood (now largely demolished for urban renewal) and along the Fifeville and 10th and Page corridors. These areas became centers of Black business, education, and religious life, with churches like First Baptist Church and Mount Zion Baptist Church serving as anchors. The late 19th and early 20th centuries saw modest growth from domestic migration—White farmers from the Shenandoah Valley and Appalachia moved in for railroad and manufacturing jobs, while Black families arrived from rural Virginia during the early Great Migration. However, Charlottesville remained a small, segregated Southern city; its population was just 26,000 in 1950, with a Black share of about 22%.
Modern era (post-1965)
The 1965 Hart-Cellar Act had a delayed but significant impact on Charlottesville. Unlike major gateway cities, the area saw little immediate immigration; the foreign-born share remained below 3% through the 1980s. The real demographic shift began in the 1990s and accelerated after 2000, driven by the University of Virginia’s global recruitment of faculty, researchers, and graduate students, as well as the growth of the UVA Health System. Today, the foreign-born population stands at 5.9%, a modest share but one that is highly concentrated among the university-affiliated population.
The largest post-1965 immigrant group is East/Southeast Asian, comprising 5.4% of the population. Chinese and Korean families, many connected to UVA’s engineering and medical schools, have settled primarily in the neighborhoods near the university—such as the Venable and Lewis Mountain areas—and in newer subdivisions along the city’s northern edge near the Albemarle County line. A smaller but growing Indian community (1.6%) has formed around the same university corridors, with professionals in tech, medicine, and academia. Hispanic residents (6.8%) are a more recent arrival, largely from Mexico and Central America, working in construction, hospitality, and landscaping; they concentrate in the city’s southern and eastern sections, including the Belmont and South First Street areas. The Black population has declined from its historical high of roughly 25% in 1970 to 16.8% today, as middle-class Black families have moved to surrounding Albemarle County suburbs like Hollymead and Pantops, while the city has become more expensive and university-dominated.
Domestic migration has been equally transformative. Since the 1990s, Charlottesville has attracted a steady influx of college-educated professionals from the Northeast and West Coast, drawn by the university, the scenic Blue Ridge setting, and a reputation as a liberal enclave. This has driven rapid gentrification: the city’s population grew 15% between 2000 and 2020, with median home prices tripling. The historic Black neighborhoods of Fifeville and 10th and Page have seen significant displacement, as longtime residents sell to newcomers. Meanwhile, the city has also become a destination for retirees and second-home buyers from Washington, D.C., and Northern Virginia, who seek a smaller, slower-paced alternative.
The future
Charlottesville’s population is likely to become more diverse in the coming decade, but the pace will be gradual. The foreign-born share is projected to rise to 8-10% by 2035, driven by continued university recruitment and the expansion of the UVA Health System, which is building a new hospital and research complex. East/Southeast Asian and Indian communities will likely grow fastest, as UVA’s STEM and medical programs continue to attract international talent. The Hispanic population is also expected to increase, though more slowly, as the construction and service sectors expand. The Black population share may stabilize or decline slightly, as displacement pressures persist and younger Black families continue to move to more affordable suburbs in Albemarle and Fluvanna counties.
The city’s cultural identity is evolving from a historically Black-and-white Southern town into a more multiethnic, globally connected university city. This shift is creating tensions: rising housing costs are pushing out lower-income residents of all races, while the city’s politics—already among the most liberal in Virginia—are becoming more focused on affordability and equity. The next 10-20 years will likely see continued infill development, denser housing near the university and downtown, and a slow but steady diversification of the population, though Charlottesville will remain a predominantly White, highly educated city compared to the state and national averages.
For someone moving in now, Charlottesville offers a dense, walkable urban experience with a strong sense of place, but it is an increasingly expensive and competitive housing market. The city is becoming more diverse and globally oriented, yet it retains a distinctly Virginian character—a place where the legacy of Thomas Jefferson and the university coexists with a growing multicultural population and a sharp awareness of its own history. New arrivals should expect a community that values education, activism, and the outdoors, but also one where affordability and inclusion remain pressing challenges.

* Values derived from national, state, county, city and local statistics and may differ in a specific area. Last updated: 2026-07-10T02:08:41.000Z
Narrative content on this page is AI-generated and may contain mistakes. Verify any details that matter before acting on them.
ReloMaps may earn a commission from affiliate links at no extra cost to you.

