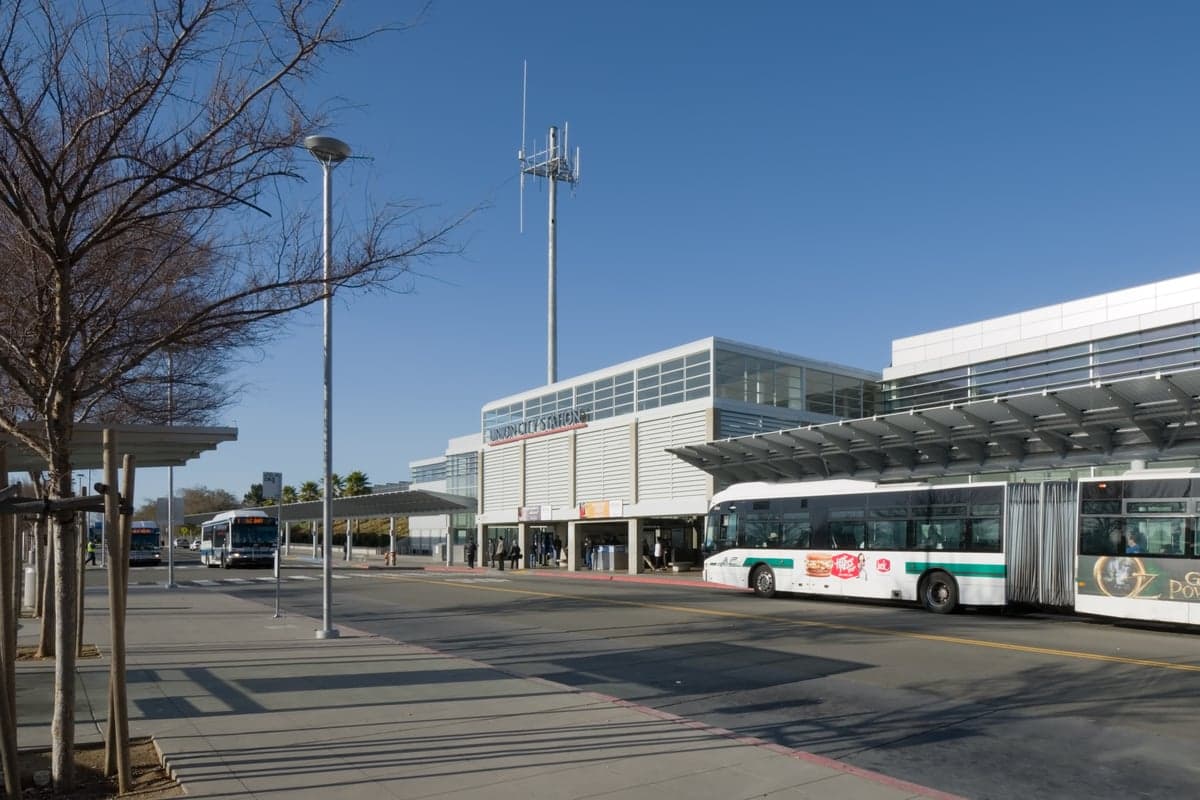
Photo: Wikipedia
Quality of Life in Union City, CA
A high quality of life with strong walkability, manageable living costs, healthy neighborhood signals, and solid amenity access.
What does Quality of Life tell us?
Quality of Life blends cost of living, nearby amenities, socioeconomic signals, and neighborhood character. City-level scores represent the whole municipality; individual neighborhoods can differ.
What does this tell us?
Quality of Life blends cost of living, nearby amenities, socioeconomic signals, and neighborhood character. City-level scores represent the whole municipality; individual neighborhoods can differ.
Cost of Living
190% above national average
The Real Cost of Living in Union City, CA for 2026
| Tier | Individual | Family (4) |
|---|---|---|
| Survival | $43k | $81k |
| Comfortable | $147k | $215k |
| Luxury | $215k+ | $333k+ |
| Elite (Top 5%) | $253k+ | $392k+ |
64%
The Area Signal
A metric tracking the socioeconomic signals of the area.
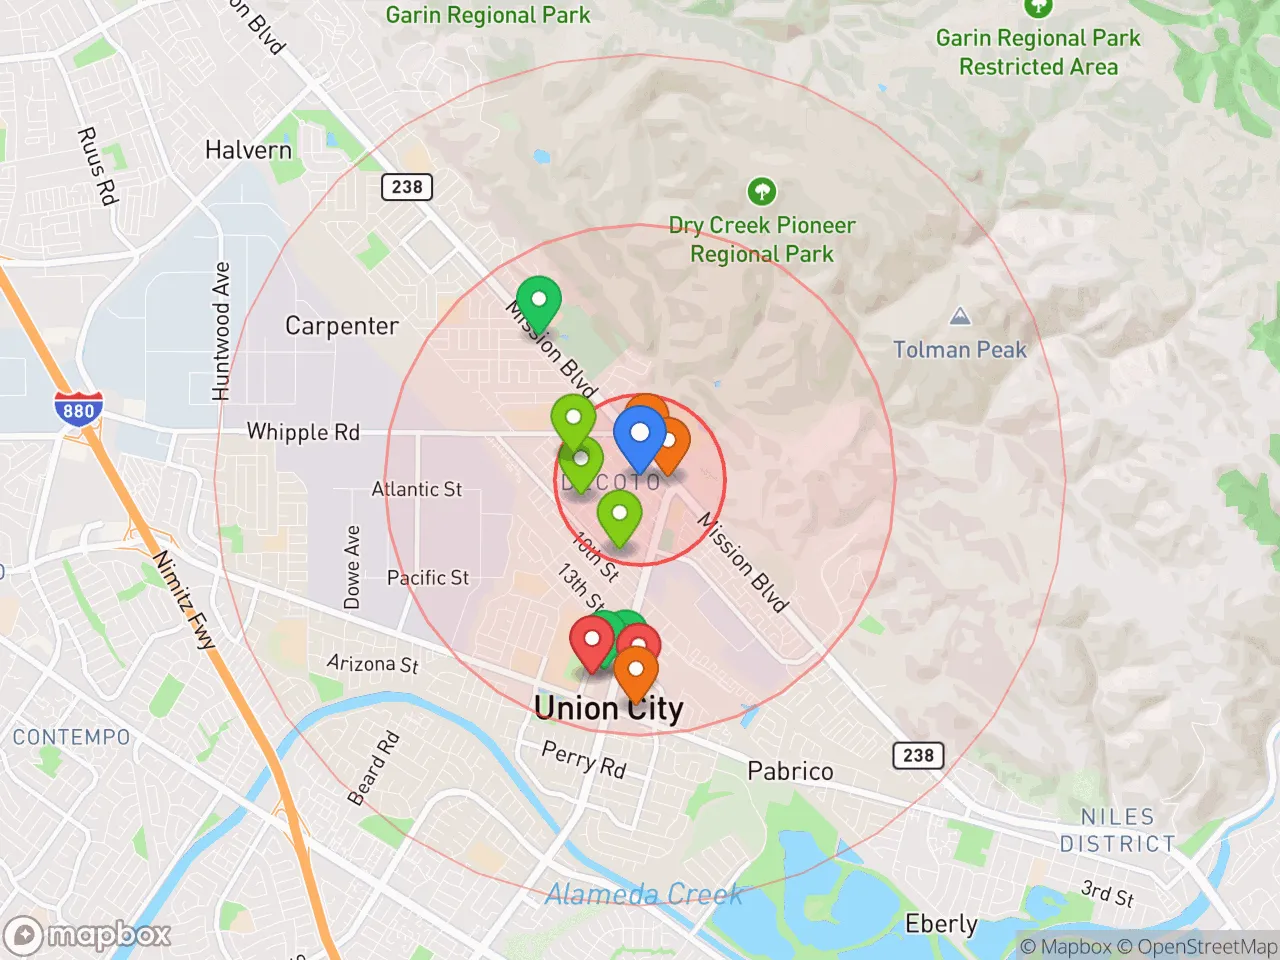
Hobbies
Explore the areaGroceries
7 within 10 miles
Gas
20 within 10 miles
Hospital
20 within 20 miles
Airport
SAN — Oakland San Francisco Bay
Post Office
USPS — Union City, CA
Critical Amenities
Quality-of-Life Analysis
Union City, California, is a high-cost, family-oriented suburb in the southern East Bay, where the cost of living index sits at 290 — nearly three times the U.S. average. The city’s population skews toward established middle- and upper-middle-class households, many of them first- and second-generation Asian and Latino families who have traded longer commutes for larger homes and quieter streets than those found in neighboring Fremont or Hayward. With a median home value of $1,058,200, Union City is not a starter-home market; it is a place where dual-income professional households, tech workers, and longtime Bay Area residents put down roots.
How Union City housing costs compare to Fremont, Hayward, and the broader Bay Area
Union City’s housing market sits in a narrow band between the premium prices of Fremont to the south and the more moderate costs of Hayward to the north. The median home value of $1,058,200 is roughly 15% below Fremont’s typical price point but about 25% above Hayward’s, making it a middle-ground option for buyers who want Alameda County access without Fremont’s sticker shock. Renters face a median monthly rent of $2,713, which is slightly below the Bay Area regional average but still demands a household income of roughly $108,000 per year to stay within the standard 30% housing-cost guideline. Property taxes are capped by California’s Proposition 13, so long-term homeowners often pay significantly less than new buyers, creating a noticeable gap between what established residents and newcomers pay for similar homes.
Affordability is the city’s central tension. The cost of living index of 290 means groceries, utilities, and healthcare all run well above national norms, though housing remains the dominant expense. Compared to San Francisco or Palo Alto, Union City offers relative value — but relative only to some of the most expensive real estate in the country. For a family earning the Alameda County median household income of roughly $130,000, buying a median-priced home is a stretch; renting is more feasible but still consumes a substantial share of take-home pay.
What daily life is like for families: schools, shopping, and commute realities
Daily life in Union City revolves around the New Haven Unified School District, which serves the city alongside parts of Fremont and Hayward. The district’s high schools, including James Logan High School, are large and diverse, with strong Advanced Placement programs and competitive athletics that draw families specifically for the academic and extracurricular offerings. The city’s commercial spine is along Alvarado-Niles Road and Decoto Road, anchored by Union Landing Shopping Center, which provides big-box retail, dining, and a movie theater without requiring a trip to a larger regional mall.
The average commute of 32.9 minutes is a defining feature of daily life. Many residents work in Silicon Valley, Oakland, or San Francisco, and the commute is made manageable by Union City’s BART station — the terminus for the Warm Springs/South Fremont line — which offers direct rail access to downtown San Francisco in about 50 minutes. Driving to San Jose takes roughly 25 minutes via Interstate 880, while Oakland is about 20 minutes north. The trade-off is clear: residents accept longer travel times in exchange for single-family homes with yards, quieter neighborhoods, and a slower pace than the urban core. Weekend life centers on the city’s parks, the nearby Don Edwards San Francisco Bay National Wildlife Refuge, and quick drives to the hills of Fremont or the shoreline trails of Hayward.
Union City is best suited for families and long-term Bay Area professionals who prioritize space, schools, and community stability over proximity to urban nightlife or cutting-edge cultural amenities. Singles and young renters may find the cost-to-lifestyle ratio less compelling, especially given the commute and the suburb’s quiet, residential character. For those who can absorb the housing costs — or who bought years ago under Prop 13 — Union City delivers a dependable, family-centric quality of life that remains one of the more balanced options in the southern East Bay.

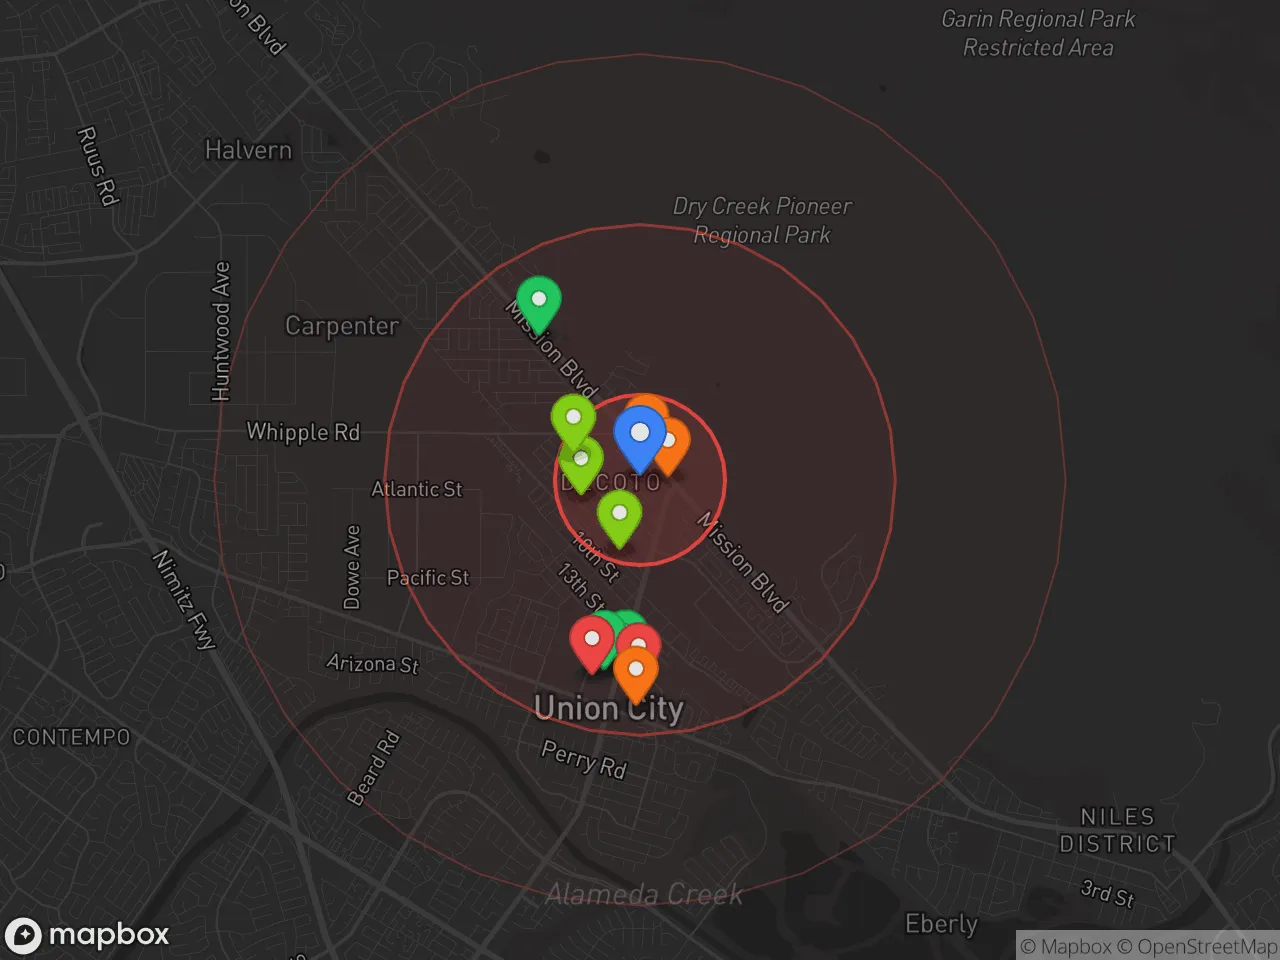
Crime in Union City, CA
Crime rates similar to the national median for U.S. locations.
Violent CrimeViolent Crime Analysis
Property CrimeProperty Crime Analysis
Crime Analysis
Union City, California, reports a violent crime rate of 453.3 incidents per 100,000 residents and a property crime rate of 1,825.5 per 100,000. These figures place the city in a concerning position relative to national averages, particularly when factoring in the broader context of Alameda County’s progressive criminal justice policies. Residents and prospective movers should weigh these statistics against the reality that local district attorneys and judges often prioritize rehabilitation over incarceration, a philosophy that can result in higher recidivism and more offenders remaining on the street.
Crime in context
Union City’s violent crime rate is roughly 30% higher than the national average of 380 per 100,000, while its property crime rate exceeds the U.S. median by approximately 15%. Compared to California’s statewide violent crime rate of 442 per 100,000, Union City is slightly above the mark. The city’s proximity to Oakland and San Francisco—both metros with well-documented crime challenges—amplifies these risks. The Alameda County District Attorney’s office, under progressive leadership, has implemented policies such as declining to prosecute certain low-level offenses and reducing cash bail, which critics argue embolden repeat offenders. This judicial environment means that even when arrests occur, swift consequences are not guaranteed, directly impacting public safety.
What residents experience
Property crime is the most tangible daily concern for Union City residents. Car burglaries, package thefts, and residential break-ins are common, particularly in neighborhoods near major transit corridors like the Union City BART station. The city’s 1,825.5 property crime rate translates to roughly 5 incidents per day across a population of about 75,000. Violent crime, while less frequent, includes aggravated assaults and robberies that often occur in commercial areas or near transit hubs. Residents report feeling safest in gated communities and newer developments, while older neighborhoods with easier street access see more incidents. The police department’s response times average 8-12 minutes for priority calls, but community feedback indicates frustration with follow-up investigations, as limited resources are stretched across a growing city.
Neighborhood-level variation
Safety in Union City is not uniform. The western side, near the bay and industrial zones, experiences higher property crime rates, while the eastern hills—home to newer subdivisions like the Dyer Street area—report fewer incidents. The central corridor along Alvarado Boulevard and the area surrounding the BART station are hotspots for theft and occasional violent encounters. Prospective residents should research specific blocks, as crime can vary significantly even between adjacent streets. Overall, Union City’s safety profile reflects a city grappling with the consequences of regional progressive justice policies, where the balance between offender leniency and public protection remains a persistent challenge.
* Values derived from national, state, county, city and local statistics and may differ in a specific area. Last updated: 2026-09-05T18:01:00.000Z
Narrative content on this page is AI-generated and may contain mistakes. Verify any details that matter before acting on them.
ReloMaps may earn a commission from affiliate links at no extra cost to you.

