Photo: Wikipedia
Demographics of Union City, CA
Affluence Level in Union City, CA
An upper-middle-class area. Household wealth, education levels, and homeownership run ahead of national benchmarks.
People of Union City, CA
Union City, California, is a densely settled, majority-minority city of 68,141 residents where East and Southeast Asian communities (39.7%) and Indian-subcontinent communities (15.7%) together form the largest population blocs, alongside a significant Hispanic population (19.3%) and a smaller White population (14.6%). With 45.3% of adults holding a college degree and a foreign-born share of 15.1%, the city is a highly educated, immigrant-rich suburb that blends older working-class roots with a newer professional-class identity. Its character is defined by tight-knit ethnic enclaves, strong family-oriented neighborhoods, and a political tilt toward moderate-to-liberal pragmatism, though its fiscal conservatism and emphasis on public safety appeal to many relocation-minded families.
How the city was settled and grew
Union City was incorporated in 1959, making it a genuinely post-war suburb with no colonial-era history. Its original population was drawn by agriculture and the canning industry along the Alameda Creek floodplain. In the late 19th and early 20th centuries, Portuguese and Italian immigrants arrived to work the region’s fruit orchards and vegetable fields, settling in what is now the Decoto District, the city’s historic downtown core. The Southern Pacific Railroad line through Decoto made it a natural landing point for these early waves. A smaller but notable group of Japanese-American farmers worked the land before World War II, though many were displaced by internment. By mid-century, the canneries—especially the Hunt’s and Del Monte plants—drew a second wave of Mexican and Filipino laborers, who established roots in the Alvarado District, the city’s other historic neighborhood, named after the original 1850s settlement of Alvarado. These two districts—Decoto and Alvarado—remain the city’s oldest residential cores and still host a visible Portuguese and Mexican cultural presence in their older housing stock and local businesses.
Modern era (post-1965)
The 1965 Hart-Cellar Immigration Act fundamentally reshaped Union City’s population. The first major post-1965 wave was Filipino immigration, with families settling in the Union Square area and the newer subdivisions east of the Nimitz Freeway (I-880). By the 1980s, Chinese and Vietnamese refugees and immigrants began arriving, drawn by affordable housing and proximity to Silicon Valley’s service economy. They concentrated in the Cabello and Bella Vista neighborhoods, where mid-century ranch homes and townhouses offered entry-level homeownership. The 1990s and 2000s saw a dramatic surge of Indian-subcontinent immigrants—primarily from Gujarat and Punjab—who were drawn by the tech boom and the city’s top-rated New Haven Unified School District. These families clustered in the Northgate and Ponderosa neighborhoods, areas built out in the 1990s with larger single-family homes. The White population, which was a majority as late as 1980, has steadily declined to 14.6% as of the latest data, with many older White families aging in place in Decoto and Alvarado while younger White households have largely moved to pricier Fremont or Pleasanton. The Black population, at 5.3%, is relatively small and dispersed, with no single dominant neighborhood concentration.
The future
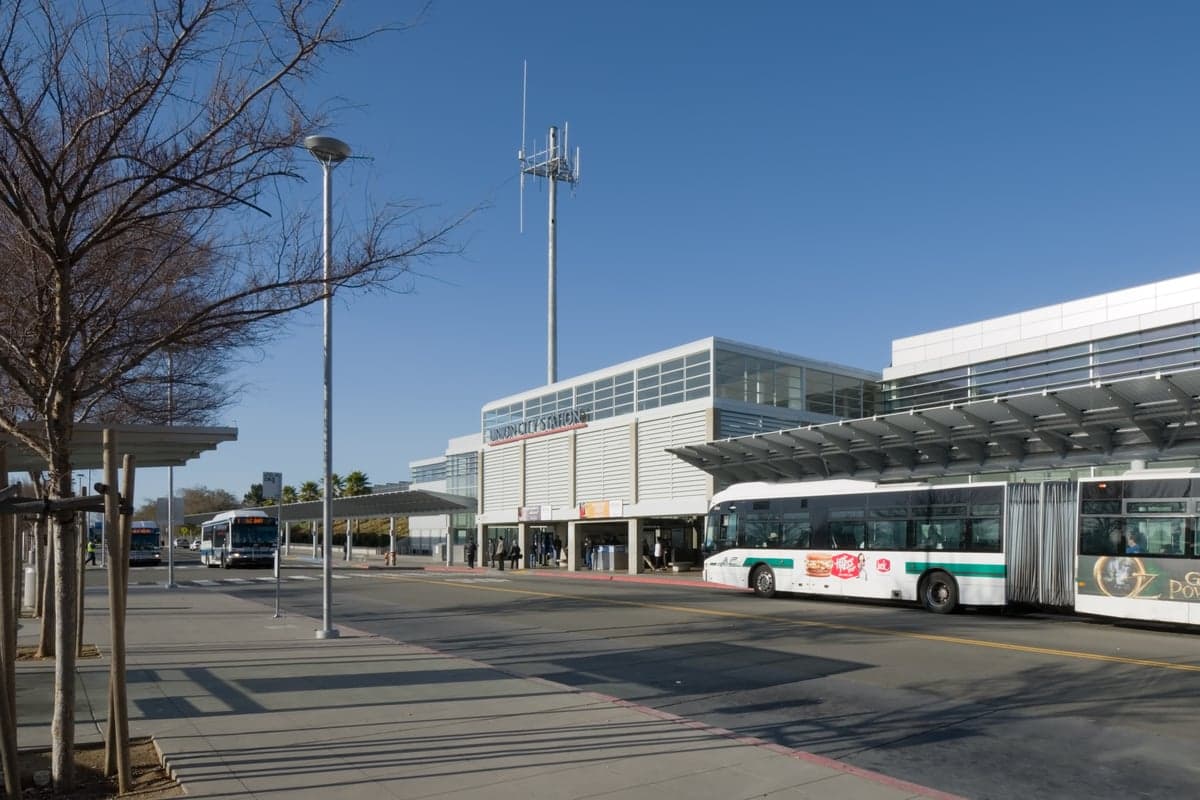
Union City’s population is becoming more, not less, diverse, but the nature of that diversity is shifting. The East/Southeast Asian share (39.7%) is likely to remain stable or grow modestly, driven by continued immigration from China and the Philippines and by second-generation families staying in the area. The Indian-subcontinent share (15.7%) is the fastest-growing segment, fueled by high-skilled tech workers who can afford the city’s median home price (around $1.1 million as of 2025). New development is concentrated in the Station District, a transit-oriented project near the Union City BART station, which is attracting younger, more diverse professionals—many of them Indian and Chinese—into mixed-use apartments and condos. The Hispanic share (19.3%) is projected to hold steady, with some dispersal from the older Alvarado core into newer subdivisions. The White share will likely continue a slow decline as older homeowners sell to younger immigrant families. Over the next 10-20 years, Union City is on track to become a majority-Asian (combining East/Southeast Asian and Indian-subcontinent) suburb with a strong professional-class tilt, while retaining its Hispanic and Filipino working-class roots in the older districts.
For someone moving in now, Union City offers a stable, family-oriented environment with excellent schools and a genuinely multicultural daily life—where a Saturday morning might mean dim sum in Cabello, samosas in Northgate, and a Portuguese festival in Decoto. It is becoming a denser, more transit-connected suburb that rewards homeowners with strong property values and offers renters a foothold in the Bay Area’s expensive housing market. The city’s identity is shifting from a quiet blue-collar suburb to a diverse, upwardly mobile community where educational attainment and homeownership are the dominant values.

* Values derived from national, state, county, city and local statistics and may differ in a specific area. Last updated: 2026-09-05T18:01:00.000Z
Narrative content on this page is AI-generated and may contain mistakes. Verify any details that matter before acting on them.
ReloMaps may earn a commission from affiliate links at no extra cost to you.

