Photo: Wikipedia
Demographics of Maverick County
Affluence Level in Maverick County
A below-average socioeconomic profile. Incomes, home values, and educational attainment trail the U.S., with higher poverty and unemployment.
People of Maverick County
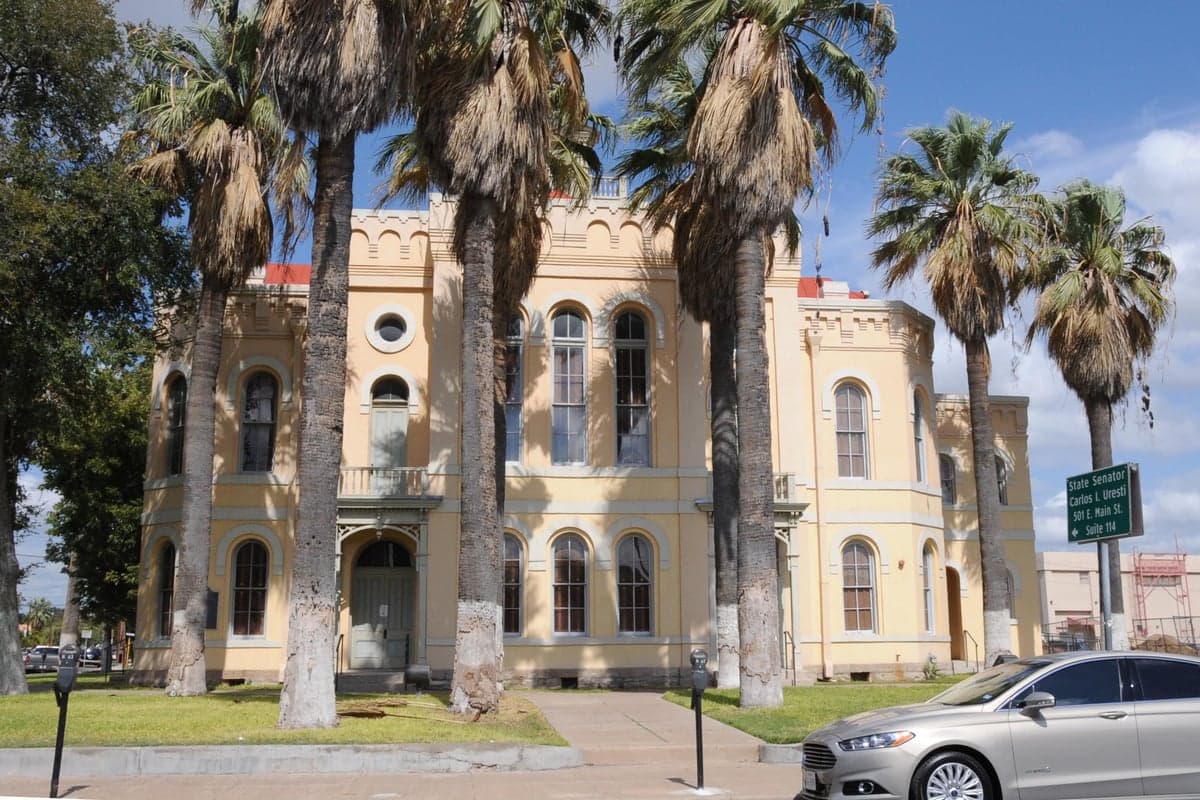
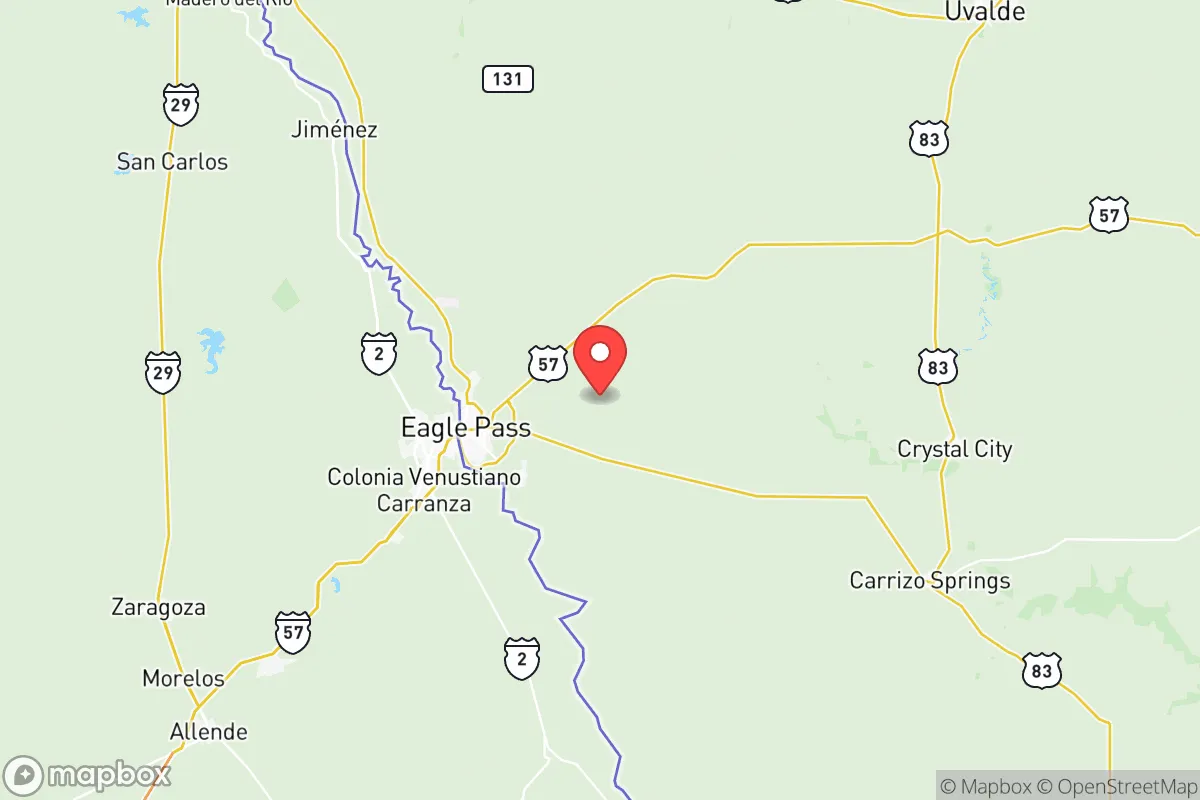
Maverick County, Texas, is a 94.9% Hispanic community of 57,770 residents, defined by its deep-rooted borderland culture and a population density of roughly 12 people per square mile. The county’s identity is overwhelmingly shaped by families of Mexican descent, many of whom trace their lineage in the region back centuries, long before the current international boundary existed. With a foreign-born population of 16.8% and a notably low college attainment rate of 15.3%, the county presents a distinct demographic profile that is both historically stable and economically challenged. The people of Maverick County are overwhelmingly native Spanish speakers, with a strong sense of place centered on the county seat of Eagle Pass and the smaller communities of El Indio and Quemado.
Settlement & growth (pre-1960)
Before any European presence, the land that is now Maverick County was home to nomadic bands of Coahuiltecan and Lipan Apache peoples, who followed seasonal game and water sources along the Rio Grande. Spanish exploration and missionary activity began in the late 17th century, but permanent European settlement did not take hold until the mid-18th century, when Spanish authorities established the San Juan Bautista mission complex just south of the river in present-day Guerrero, Coahuila. This mission served as a gateway for Spanish colonists and Tlaxcalan indigenous allies, and the families that settled on both sides of the river formed the foundational population of the region. The area remained sparsely populated under Mexican rule, with large land grants like the San Antonio de la Bexar grant encompassing much of what is now the county.
The modern settlement of Maverick County began in earnest after the 1848 Treaty of Guadalupe Hidalgo, which fixed the Rio Grande as the U.S.-Mexico border and created the county itself in 1856. The town of Eagle Pass was founded as a military outpost (Fort Duncan) to secure the new boundary, and it quickly became a commercial hub for cross-border trade. The first major Anglo wave arrived in the 1850s and 1860s, consisting of ranchers and merchants drawn by the open range and the promise of the cattle trade. These early Anglo settlers, primarily of Scots-Irish and English descent, established large ranches that dominated the local economy for decades. However, the majority of the population remained Mexican-American, as the existing ranchero families and newly arriving Mexican laborers formed the backbone of the workforce. The railroad reached Eagle Pass in 1883, connecting the county to national markets and spurring a modest population increase, but the area never attracted the large-scale European immigration seen in central Texas. By 1900, the county’s population was roughly 4,000, with Eagle Pass as the only incorporated town.
The 20th century saw a steady, organic growth driven by natural increase and continued migration from Mexico. The Mexican Revolution (1910-1920) pushed thousands of refugees across the border, many of whom settled permanently in Eagle Pass and the surrounding colonias. The county’s economy remained tied to ranching, agriculture (especially onions and pecans), and cross-border commerce, with the port of entry at Eagle Pass becoming increasingly important. The population reached 12,000 by 1950, still overwhelmingly Hispanic and native-born, with a small Anglo minority concentrated in ranching and business ownership. The construction of the Camino Real International Bridge in the 1950s further cemented Eagle Pass’s role as a trade gateway, but the county remained isolated from the rapid suburbanization and industrial growth that transformed other parts of Texas.
Modern era (post-1965)
The post-1965 era, shaped by the Hart-Cellar Act and the broader forces of globalization, reinforced Maverick County’s existing demographic character rather than diversifying it. Unlike many U.S. counties that saw an influx of Asian, Indian, or African immigrants after 1965, Maverick County’s foreign-born population (16.8%) is overwhelmingly Mexican. The county did not experience significant immigration from East or Southeast Asia (0.2%), the Indian subcontinent (0.2%), or the Middle East. The Black population remains negligible at 0.2%, and the non-Hispanic white population has shrunk to just 2.8% as older Anglo families have moved to larger Texas cities or retired elsewhere. The dominant demographic trend has been the continued growth of the Hispanic population through both high birth rates and ongoing migration from the Mexican states of Coahuila, Nuevo León, and Tamaulipas.
The most significant modern development has been the expansion of Eagle Pass as a binational commercial and industrial center. The North American Free Trade Agreement (NAFTA), implemented in 1994, dramatically increased truck traffic and trade volume through the Eagle Pass port of entry, creating jobs in logistics, warehousing, and customs brokerage. This economic shift drew new residents from both sides of the border, with many Mexican nationals commuting daily or settling permanently in Eagle Pass. The city’s population grew from roughly 22,000 in 1990 to over 28,000 by 2020, while the county as a whole reached 57,770. The smaller communities of El Indio and Quemado remain rural and sparsely populated, with fewer than 200 residents each, and have seen little demographic change. Suburbanization has been limited, with most new housing concentrated in Eagle Pass’s expanding subdivisions like the Rosita Valley area and along Highway 277. The county’s educational attainment remains low (15.3% college educated), reflecting the economic structure of low-skill trade and service jobs, though a growing professional class of lawyers, customs brokers, and healthcare workers is emerging in Eagle Pass.
The future
Maverick County is projected to become slightly more diverse in the coming decades, but the Hispanic share of the population will remain above 90% for the foreseeable future. The non-Hispanic white population is likely to continue its slow decline, while the small Asian and Indian populations may grow modestly as healthcare and trade sectors expand. The county’s future is tied directly to the fortunes of the Eagle Pass port of entry, which is undergoing a major expansion with the construction of a new commercial bridge and inspection facility. This infrastructure investment is expected to create thousands of new jobs and attract additional residents, potentially pushing the county’s population past 65,000 by 2040. The cultural identity of the county will remain deeply binational, with Spanish as the dominant language and family ties to Mexico remaining strong. Younger residents are increasingly bilingual and bicultural, and a growing number are pursuing higher education in San Antonio or Austin before returning to Eagle Pass for professional careers. The county faces challenges in diversifying its economy beyond trade and government employment, and the low college attainment rate suggests that many residents will continue to work in low-wage service and logistics jobs.
For someone moving to Maverick County today, the region offers a stable, family-oriented community with a strong sense of cultural continuity and a low cost of living. The population is overwhelmingly Hispanic and native-born, with a deep connection to the land and to Mexico just across the river. The county is not becoming a melting pot of diverse immigrant groups; rather, it is a place where a single cultural tradition has persisted and deepened over two centuries. New residents, whether Anglo or from other backgrounds, will find a welcoming but culturally distinct environment where Spanish fluency and an understanding of border life are significant advantages. The future points toward gradual growth, continued economic reliance on cross-border trade, and a demographic profile that will remain one of the most Hispanic in the United States.

* Values derived from national, state, county, city and local statistics and may differ in a specific area. Last updated: 2026-11-20T20:00:47.000Z
Narrative content on this page is AI-generated and may contain mistakes. Verify any details that matter before acting on them.
ReloMaps may earn a commission from affiliate links at no extra cost to you.

