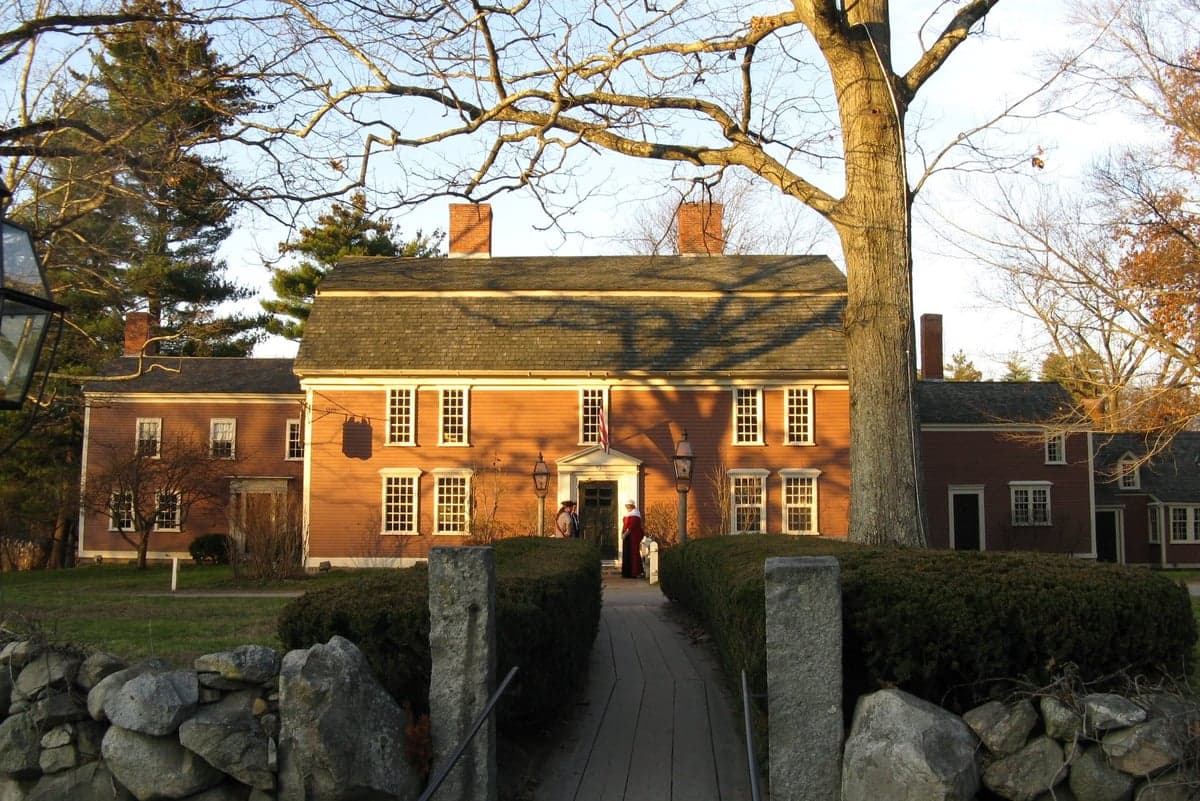
Photo: Wikipedia
Quality of Life in Sudbury, MA
Above-average quality of iife. The area offers a reasonable cost of living, decent mobility, and a mix of neighborhood amenities.
What does Quality of Life tell us?
Quality of Life blends cost of living, nearby amenities, socioeconomic signals, and neighborhood character. City-level scores represent the whole municipality; individual neighborhoods can differ.
What does this tell us?
Quality of Life blends cost of living, nearby amenities, socioeconomic signals, and neighborhood character. City-level scores represent the whole municipality; individual neighborhoods can differ.
Cost of Living
94% above national average
The Real Cost of Living in Sudbury, MA for 2026
| Tier | Individual | Family (4) |
|---|---|---|
| Survival | $23k | $43k |
| Comfortable | $171k | $252k |
| Luxury | $298k+ | $461k+ |
| Elite (Top 5%) | $350k+ | $543k+ |
90%
The Area Signal
A metric tracking the socioeconomic signals of the area.
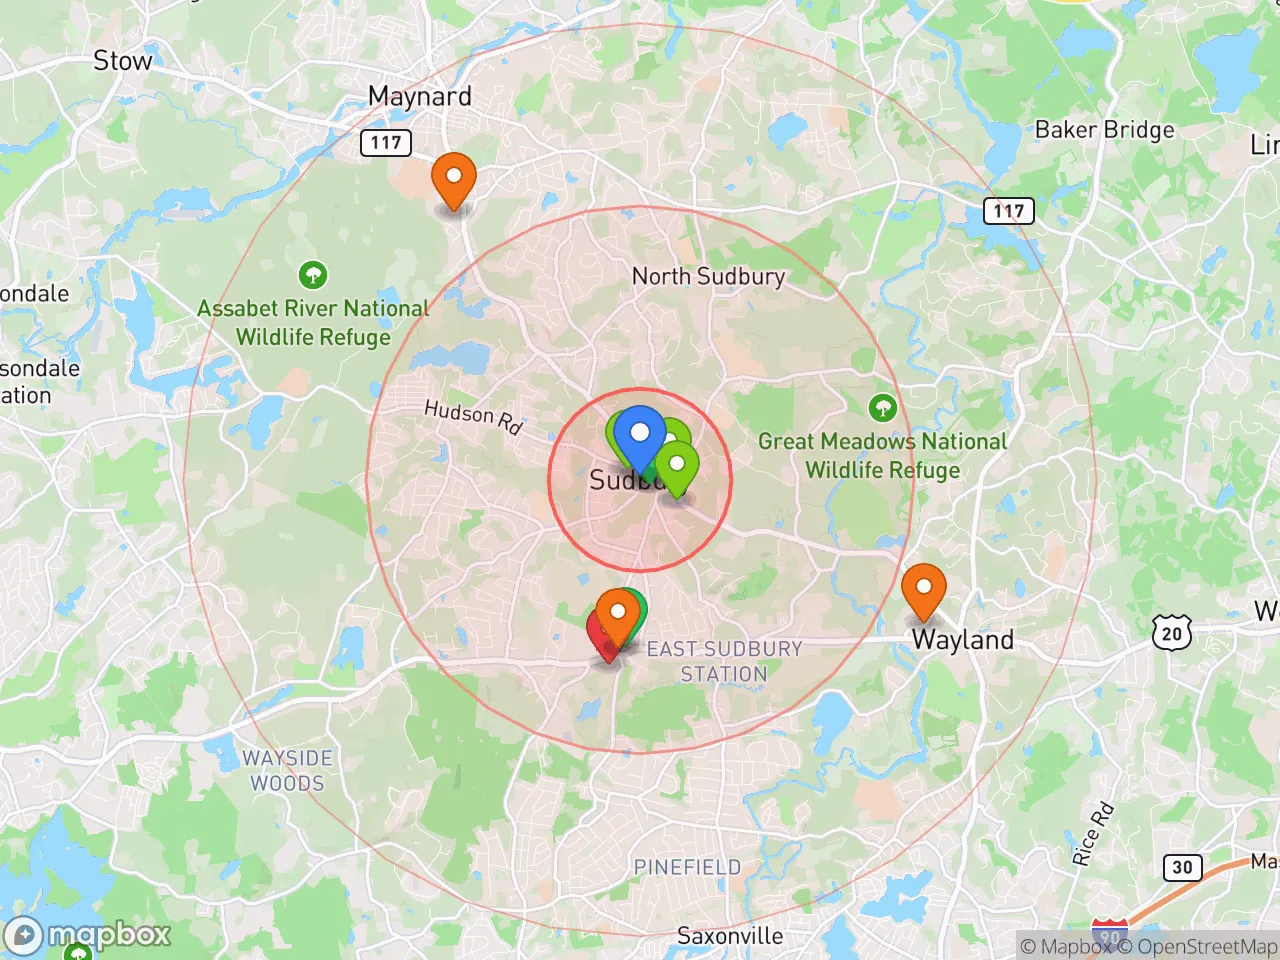
Hobbies
Explore the areaGroceries
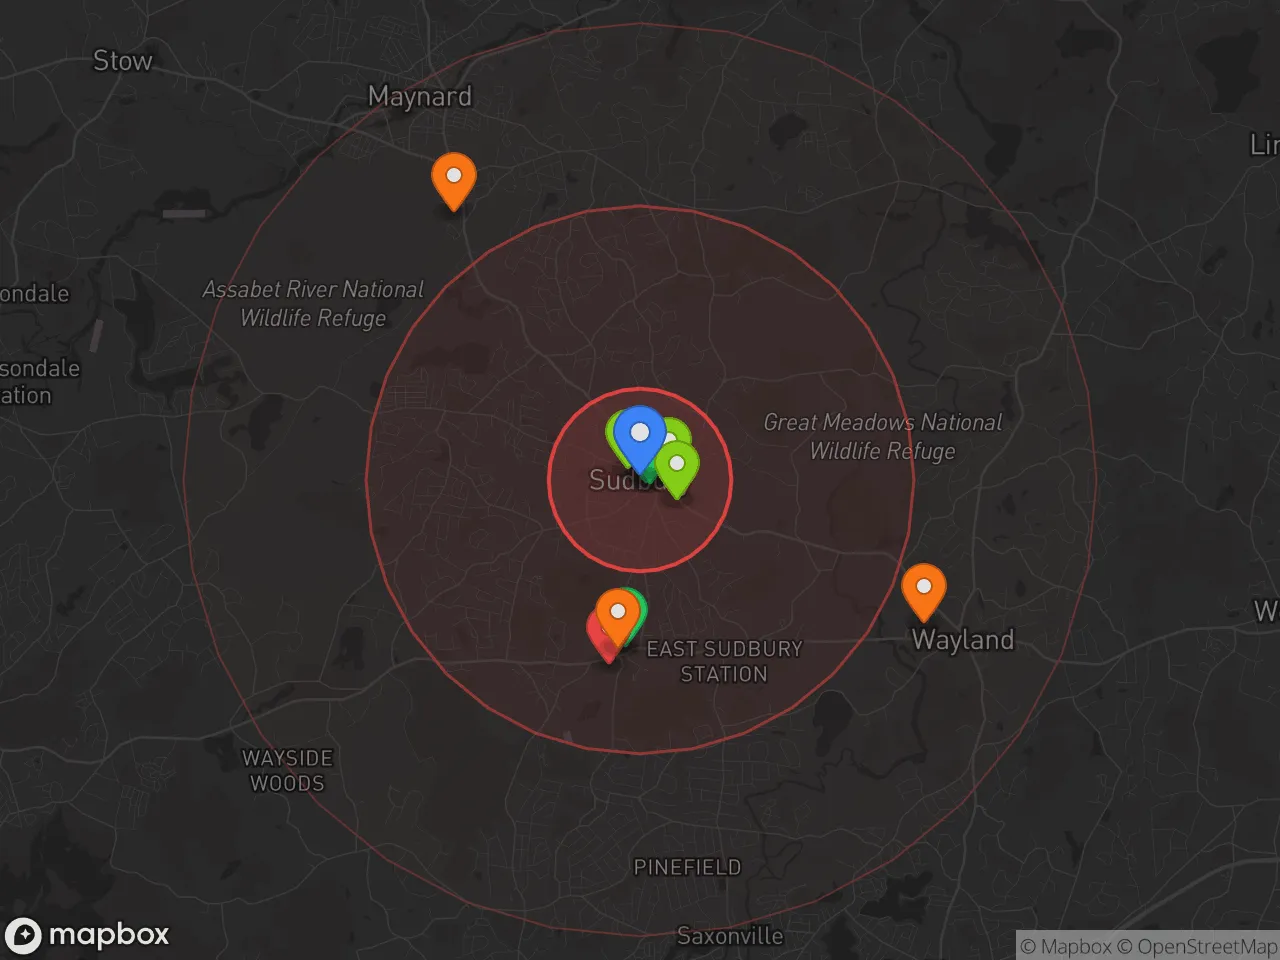
0 within 10 miles
Gas
0 within 10 miles
Hospital
0 within 20 miles
Airport
PDX — Portland International Jetport
Post Office
Critical Amenities
Quality-of-Life Analysis
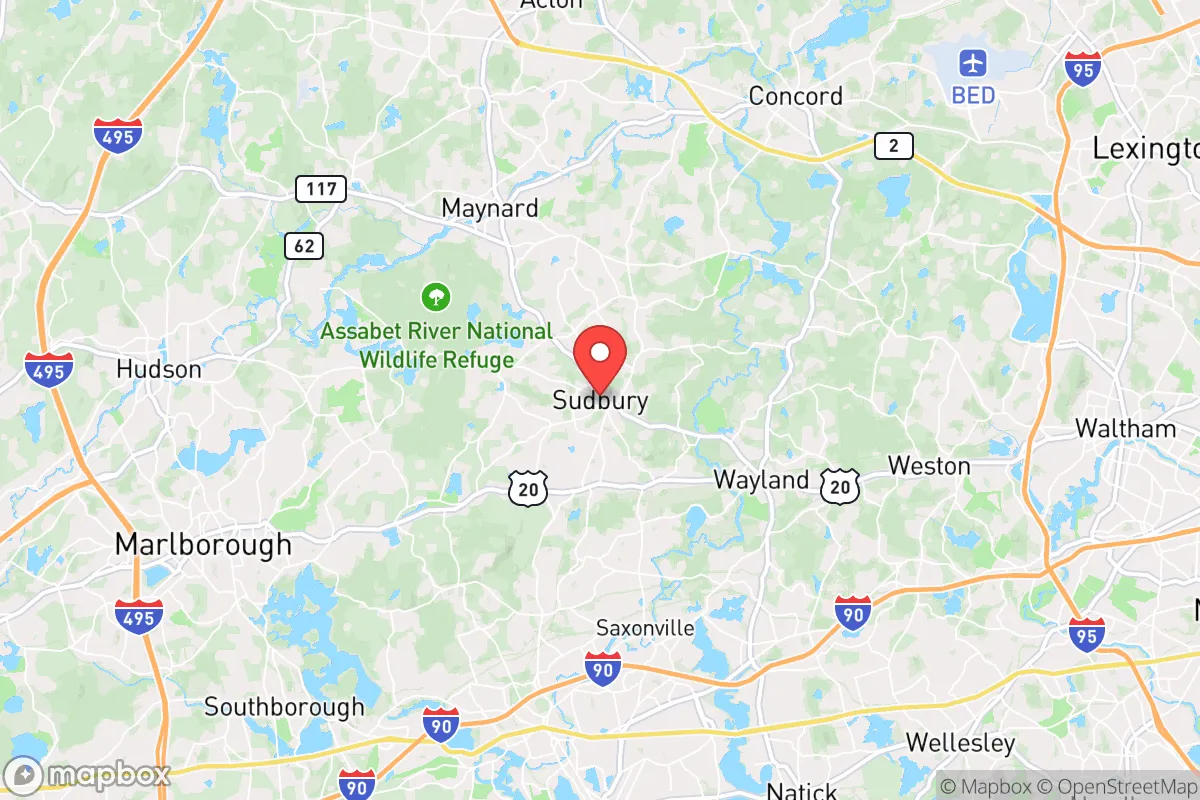
Sudbury, Massachusetts, is an affluent suburban town approximately 20 miles west of Boston, known for its top-tier public schools, large historic homes, and a predominantly professional population drawn to its blend of rural character and commuter accessibility. With a cost of living index of 194—nearly double the national average—the town attracts families and executives who prioritize education, space, and community safety over urban proximity or lower housing costs. The population of roughly 20,000 is highly educated, with a median household income well above the state average, and the town’s character is defined by its conservation land, equestrian trails, and a quiet, family-oriented social fabric.
Cost of living, housing affordability, and how Sudbury compares to nearby towns
Sudbury’s cost of living is among the highest in MetroWest, driven almost entirely by housing. The median home value of $881,800 is roughly 2.5 times the national median, though it remains below the most expensive Boston suburbs like Weston or Wellesley, where median values exceed $1.5 million. Renters face a more moderate market: the median rent of $1,331 is surprisingly low for the area, reflecting a small rental stock dominated by older apartments and accessory units rather than luxury complexes. For context, nearby Framingham (COL index 140) offers median home values around $480,000, while Concord (COL index 210) pushes above $1.1 million. Property taxes in Sudbury run approximately 1.1% of assessed value, slightly below the state average, but the high home prices mean annual tax bills often exceed $9,000. The average commute of 32 minutes—longer than the national average of 26 minutes—is a trade-off many residents accept for larger lots and lower crime rates than closer-in suburbs like Newton or Arlington.
What daily life is like for families: schools, amenities, and local rhythm
Daily life in Sudbury revolves around its nationally ranked public school system, particularly Lincoln-Sudbury Regional High School, which consistently ranks among the top 5% of Massachusetts high schools and sends over 90% of graduates to four-year colleges. The town’s 2,000 acres of conservation land, including the 400-acre Hop Brook and the Sudbury Valley Trustees trails, provide immediate access to hiking, mountain biking, and cross-country skiing. Retail and dining are limited to small clusters along Route 20 and in the historic town center, with most residents driving 10–15 minutes to the Sudbury Farms grocery or the larger shopping plazas in Wayland and Marlborough. The town lacks a traditional downtown or nightlife; instead, the social calendar is built around school sports, town recreation programs, and seasonal events like the Sudbury Pops Concert and the annual Town Day. For daily errands, the absence of a major supermarket within town limits is a noted inconvenience, though the nearby Whole Foods in Wayland and Market Basket in Framingham fill the gap.
Sudbury is best suited for families with school-aged children who value academic excellence, outdoor space, and a low-crime environment over urban amenities or short commutes. Empty-nesters and remote workers also thrive here, drawn by the quiet streets and access to Boston via the MBTA commuter rail from South Sudbury station (a 45-minute ride to North Station). Singles and young professionals may find the social scene limited and the housing costs prohibitive, while retirees on fixed incomes often struggle with property taxes unless they downsize to one of the town’s few 55+ communities. For those who can afford the premium, Sudbury offers a quality of life anchored by exceptional schools, abundant nature, and a strong sense of community—but it demands a willingness to drive for most services and a tolerance for one of the highest costs of living in the region.

Crime in Sudbury, MA
Lower crime rates than 94% of comparable U.S. locations.
Violent CrimeViolent Crime Analysis
Property CrimeProperty Crime Analysis
Crime Analysis
Sudbury, Massachusetts, is one of the safest communities in the greater Boston metro area, with a violent crime rate of just 60 incidents per 100,000 residents and a property crime rate of 290.1 per 100,000. These figures place Sudbury well below both the Massachusetts state average and national benchmarks, making it a consistently low-crime outlier in a region where progressive justice policies often raise safety concerns for residents.
Crime in context
Sudbury’s violent crime rate of 60 per 100,000 is roughly one-fifth the national average of approximately 380 per 100,000, and significantly lower than the Massachusetts state rate of around 300 per 100,000. Property crime in Sudbury, at 290.1 per 100,000, also undercuts the national average of about 1,950 per 100,000 and the state average of roughly 1,100 per 100,000. These statistics reflect a community where serious offenses like assault, robbery, and burglary are rare events. However, it is important to note that Sudbury is situated within the broader Boston metro area, where many jurisdictions are overseen by progressive district attorneys and judges. In neighboring cities like Boston and Cambridge, policies emphasizing diversion and reduced incarceration have been linked to rising recidivism and property crime. While Sudbury itself remains insulated from these trends due to its affluent, low-density character, residents should be aware that the regional justice environment can influence crime patterns in surrounding towns and along transit corridors.
What residents experience
For those living in Sudbury, the primary safety concerns are minor property crimes such as package theft, bicycle theft, and occasional vehicle break-ins, particularly near commuter rail stations and shopping plazas. Violent crime is virtually nonexistent in daily life, with most incidents involving domestic disputes or isolated altercations rather than random street crime. The town benefits from a well-funded police department and active neighborhood watch programs. However, the broader context of progressive criminal justice reform in Massachusetts means that even low-crime suburbs like Sudbury are not immune to spillover effects. Repeat offenders from nearby cities with lenient bail and sentencing practices sometimes target affluent suburbs for property crime, a pattern seen across the MetroWest region. Residents should remain vigilant about securing homes and vehicles, even in this otherwise safe environment.
Neighborhood-level variation in Sudbury is minimal, with all areas of town reporting similarly low crime rates. The most significant difference is between the more rural, wooded sections and the denser village center near Route 20, where commercial activity generates slightly higher rates of minor theft. Overall, Sudbury offers an exceptionally safe living environment, but the regional influence of progressive justice policies means that no community in the Boston metro area can afford complete complacency regarding property crime prevention.
* Values derived from national, state, county, city and local statistics and may differ in a specific area. Last updated: 2026-10-12T22:13:34.000Z
Narrative content on this page is AI-generated and may contain mistakes. Verify any details that matter before acting on them.
ReloMaps may earn a commission from affiliate links at no extra cost to you.

