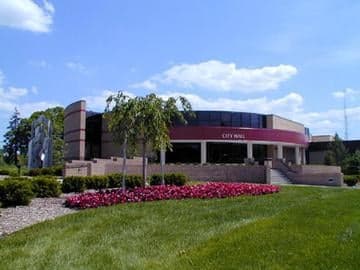
Photo: Wikipedia
Demographics of Sterling Heights, MI
Affluence Level in Sterling Heights, MI
A middle-class area roughly in line with national averages across income, home values, education, and employment.
People of Sterling Heights, MI
The people of Sterling Heights today form a predominantly white, middle-class suburban population of 133,473, characterized by a strong Eastern European cultural imprint and a growing South Asian presence. The city ranks as the second-largest in Macomb County and one of the most ethnically stable large suburbs in Metro Detroit, with a foreign-born share of 7.0% that reflects targeted immigration rather than broad diversification. Its identity is defined by post-war American prosperity, Catholic and Orthodox religious traditions, and a civic culture that prizes homeownership, public safety, and local schools.
How the city was settled and grew
Sterling Heights was never a pre-industrial village or farming hamlet. The area was originally part of Sterling Township, a sparsely populated agricultural district settled by German and Irish farmers in the 1830s and 1840s, but no concentrated settlement existed on the site until the post-World War II era. The city's true founding occurred in 1968, when residents voted to incorporate as a city to control their own zoning and avoid annexation by Warren. The original population base was overwhelmingly white and native-born, drawn from the massive suburban exodus out of Detroit during the 1950s and 1960s. These early residents were largely second- and third-generation Polish, German, and Italian families who moved north along Mound Road and Van Dyke Avenue into newly built subdivisions. The neighborhoods around Utica Road and Schoenherr Road — the city's historic core — were the first to fill, with ranch homes and split-levels on quarter-acre lots marketed to auto workers and tradesmen. The Maple Lane and Dodge Park areas developed slightly later, in the 1970s, and attracted a similar demographic: union-employed, Catholic, and politically conservative.
Modern era (post-1965)
The 1965 Hart-Cellar Act had a modest but measurable effect on Sterling Heights compared to neighboring cities. While Warren and Dearborn saw significant Arab and Chaldean immigration, Sterling Heights remained more homogeneous through the 1970s and 1980s. The city's white share in 1990 was approximately 96%. The major demographic shift began in the 1990s and accelerated after 2000, driven by two distinct streams. The first was an influx of East/Southeast Asian families — primarily Chinese and Vietnamese — who settled in the Lakeside area near the intersection of Hall Road (M-59) and Schoenherr, drawn by the then-new Lakeside Mall and the reputation of Stevenson High School. The second and larger stream was Indian-subcontinent immigration, concentrated in the Plum Brook and Belle Meade subdivisions east of Van Dyke Avenue. These families were predominantly professionals — engineers, physicians, and IT managers — employed at the nearby Chrysler Technology Center in Auburn Hills and the auto supplier corridor along M-59. Today, Indian-subcontinent residents make up 5.0% of the population, and East/Southeast Asian residents account for 3.9%, giving the city a combined Asian and Indian share of 8.9% — the highest in Macomb County outside of Troy. The Black population, at 6.5%, is smaller and more dispersed, with no single concentrated neighborhood, while the Hispanic share remains low at 2.4%.
The future
Sterling Heights is projected to remain predominantly white but to continue a slow, steady diversification over the next two decades. The white share, currently 78.2%, is declining at roughly 0.5–1.0 percentage points per year, driven by an aging native-born population and lower birth rates among longer-established families. The Indian-subcontinent community is the fastest-growing segment, with new arrivals from the tech and healthcare sectors settling in the Mound Road corridor south of 18 Mile Road, where newer townhome developments and rental apartments have been built. The East/Southeast Asian population is growing more slowly, constrained by the limited supply of high-end single-family homes in the Lakeside area. The Black and Hispanic shares are expected to rise modestly, but Sterling Heights lacks the rental housing stock and transit access that typically attract larger minority populations. The city's cultural identity is evolving from a purely Eastern European-Catholic suburb into a more pluralistic but still conservative-leaning community, where Indian-American families participate actively in local politics and school boards. For a new resident, Sterling Heights offers a stable, low-crime environment with good schools and a tax base that remains healthy — but the social texture is still defined by its post-war origins, not by the hyper-diversity of nearby Troy or Novi.
Sterling Heights is becoming a slightly more diverse, professionally oriented suburb without losing its core character as a safe, family-centered, and politically moderate-to-conservative community. For someone moving in now, the city offers the practical advantages of Macomb County — lower taxes than Oakland County, strong municipal services, and a central location near major employers — within a social environment that remains predominantly white and culturally traditional, but is gradually opening to new communities, particularly from the Indian subcontinent.

* Values derived from national, state, county, city and local statistics and may differ in a specific area. Last updated: 2026-07-10T15:29:39.000Z
Narrative content on this page is AI-generated and may contain mistakes. Verify any details that matter before acting on them.
ReloMaps may earn a commission from affiliate links at no extra cost to you.

