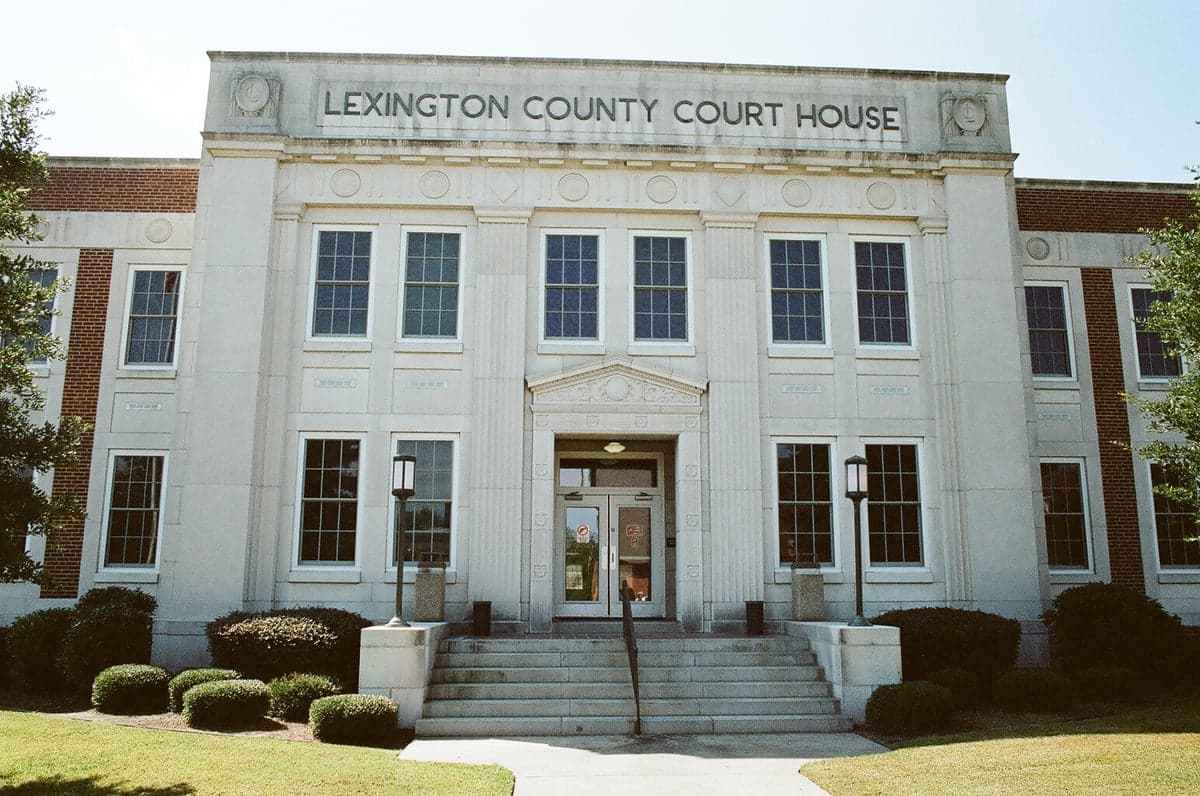
Photo: Wikipedia
Political ClimatePolitical Climate in Lexington County
Showing district-level results — no local-only data available.
Local Political AnalysisPolitical Analysis of Lexington County
Lexington County has long been a Republican stronghold, but its politics are more nuanced than the county's overall red tint suggests. With a Cook PVI of R+7—just a shade less conservative than South Carolina's statewide R+8—the county consistently delivers GOP victories, but the margins have tightened in recent cycles, especially in the suburban precincts closest to Columbia. The real story here is the growing divide between the rural, deeply conservative western half of the county and the more moderate, increasingly diverse eastern suburbs that are feeling the pull of the capital city's growth.
How it compares
While Lexington County is solidly Republican, it's actually a hair more competitive than the state as a whole. That R+7 rating means a Democratic candidate would need to outperform the national average by seven points to carry the county—tough but not impossible in a wave year. Compare that to the state's R+8, and you see Lexington is a slight outlier: it's the most populous county in the state that still votes red, but it's not as deep red as, say, Oconee or Spartanburg counties. The real variation shows up inside the county. Lexington town itself (the county seat) leans reliably Republican, with precincts like the one at Lexington High School routinely going 60-65% GOP. But head east toward the Richland County line, and you'll find Irmo and Chapin—especially the Harbison Boulevard area—where precincts have flipped to 50-55% Democratic in the last two presidential elections. The swing precincts are in the Lake Murray corridor, particularly around the Ballentine and White Rock communities, where independent voters and transplants from the Northeast have made races for county council and state house genuinely competitive. In 2024, the county's overall margin for Trump was about 58-40, down from 62-36 in 2020, a shift driven almost entirely by those eastern precincts.
What this means for residents
For conservative residents, Lexington County remains a comfortable place to live politically. The county council is solidly GOP, school board races rarely feature Democratic candidates, and the local Republican Party is well-organized with active precinct clubs. Tax policy is reliably conservative—the county's millage rate has stayed flat for years, and there's no local income tax. For liberal residents, the picture is more mixed. You'll find like-minded neighbors in Irmo and Chapin, but you'll also encounter plenty of "Keep Lexington County Red" yard signs. The practical effect is that progressive policy proposals—like zoning reforms for denser housing or increased funding for public transit—face an uphill battle at the county level. That said, the growing Democratic vote in the eastern precincts has made local elections more competitive. In 2022, a Democratic candidate for state house in District 85 (covering parts of Irmo and Chapin) came within 4 points of winning, a margin that would have been unthinkable a decade ago.
Culturally, Lexington County is a study in contrasts. The western half still feels like old-school South Carolina—church potlucks, deer hunting, and a strong "leave us alone" ethos. The eastern suburbs, by contrast, are increasingly diverse, with a growing population of young families, tech workers, and retirees from up North. This split shows up in policy debates: the county's recent fight over a proposed "dark store" tax loophole for big-box retailers pitted rural conservatives (who saw it as a tax cut) against suburban moderates (who worried about lost revenue for schools). The county's school board has also been a battleground, with conservative majorities pushing for stricter library book policies while a vocal minority of parents in Irmo and Chapin push back. If you're moving here, the key takeaway is that your experience will depend heavily on which side of the county you land on—and that the political winds are shifting, slowly but surely, toward the center.

State Political ClimatePolitical Climate in South Carolina
State Political AnalysisPolitical Environment in the State
South Carolina is a solidly Republican state with a Cook PVI of R+8, meaning it typically votes about eight points more Republican than the national average in presidential elections. The dominant coalition is a blend of traditional conservatives, evangelical Christians, and a growing number of transplants from the Northeast and Midwest who are drawn by low taxes and a slower pace of life. Over the last 10-20 years, the state has shifted rightward in statewide races, even as the fast-growing coastal areas around Charleston and the Upstate’s Greenville-Spartanburg corridor have become more competitive, creating a fascinating tension between old-guard rural conservatism and a newer, more suburban brand of Republicanism.
Urban vs. rural divide
The political map is a textbook study in contrast. The rural Lowcountry and Pee Dee regions—places like Florence, Orangeburg, and Walterboro—are deeply conservative, with many precincts voting 70-80% Republican. The Upstate, anchored by Greenville and Spartanburg, is the engine of the state’s GOP, driven by a mix of manufacturing executives, military retirees, and evangelical churches. Charleston and its surrounding suburbs (Mount Pleasant, Summerville) have trended bluer in recent cycles, with Charleston County itself flipping to Democrats in presidential races since 2016, thanks to an influx of tech workers, creatives, and out-of-state college graduates. The state’s capital, Columbia, is a purple island in a red sea—Richland County leans Democratic, while neighboring Lexington County is a GOP stronghold. The rural-urban split is sharpest in the Myrtle Beach area (Horry County), which votes Republican but is growing so fast that its political character is shifting as new retirees and remote workers arrive.
Policy environment
South Carolina’s policy posture is unmistakably conservative. There is no state income tax on Social Security benefits, and the top marginal income tax rate was cut from 7% to 6.4% in 2023, with a path to 6% by 2027. Property taxes are among the lowest in the Southeast, thanks to a 2006 law that caps annual increases on owner-occupied homes at 15% of the previous year’s value. The state is a right-to-work state with a 5.0% corporate income tax rate, and it has no statewide zoning or land-use planning mandate, giving local governments wide latitude. Education policy has been a flashpoint: the 2023 Education Savings Account (ESA) program, which provides up to $6,000 per child for private school or homeschooling expenses, was signed by Governor Henry McMaster and is one of the most expansive school choice laws in the region. On healthcare, the state has not expanded Medicaid under the Affordable Care Act, leaving roughly 200,000 low-income adults in a coverage gap. Election laws are strict: voter ID is required, early voting was expanded to two weeks in 2022, but absentee voting requires an excuse (though the excuse requirement was effectively eliminated during COVID and remains a political battleground).
Recent policy direction
The last five years have seen a sharp rightward turn on a range of issues. In 2023, the state passed a near-total abortion ban after six weeks of pregnancy, with no exceptions for rape or incest (only medical emergencies and fatal fetal anomalies). Gun laws are permissive: permitless carry (constitutional carry) became law in 2024, allowing any adult who can legally own a firearm to carry it openly or concealed without a permit. The state also passed a “Second Amendment Preservation Act” in 2021 that purports to nullify federal gun laws, though it has not been tested in court. On parental rights, the 2024 “Parents’ Bill of Rights” requires schools to notify parents of any changes to a child’s mental, emotional, or physical health, effectively barring schools from keeping a student’s gender identity or sexual orientation confidential from parents. Property rights were strengthened by a 2023 law that limits the use of eminent domain for private economic development. On voting, the 2021 “Election Integrity Act” added stricter signature verification for absentee ballots and banned ballot harvesting. The state has also passed laws restricting transgender girls from participating in female sports (2022) and banning gender-affirming care for minors (2024).
Civil unrest & political movements
South Carolina has a history of political activism that is both organized and, at times, confrontational. The Confederate flag was removed from the Statehouse grounds in 2015 after the Charleston church shooting, a watershed moment that still reverberates in local politics. The state has seen periodic protests over Confederate monuments, particularly in Charleston and Columbia, but these have largely been peaceful. On the right, the “Constitutional Carry” movement was driven by grassroots gun-rights groups like the South Carolina Carry organization, which held rallies at the Statehouse. Immigration politics are less heated than in border states, but there is a vocal minority pushing for stricter enforcement; the state passed a law in 2023 requiring all employers to use E-Verify. There is no sanctuary city policy anywhere in the state—in fact, a 2024 law prohibits local governments from adopting such policies. Election integrity remains a live issue: after the 2020 election, a small but persistent group of activists continues to push for hand-counting of ballots and paper-only voting, though the state’s current system (paper ballots with optical scanners) is widely considered secure. You won’t see daily protests, but you will see active county-level Republican and Democratic party organizations, especially in the suburbs of Greenville and Charleston.
Projection
Over the next 5-10 years, South Carolina will likely remain Republican at the statewide level, but the margins will tighten. The key demographic driver is in-migration: the state is adding about 100,000 new residents per year, many from blue states like New York, New Jersey, and California. These newcomers tend to be moderate to conservative on taxes and crime but more liberal on social issues, which could push the suburbs of Charleston, Greenville, and Columbia toward purple status. The rural areas, meanwhile, are aging and losing population, which will slowly erode the GOP’s base. The state’s congressional delegation is likely to remain 6-1 Republican in the near term, but the 1st District (coastal Charleston to Hilton Head) could become competitive again if national trends shift. The biggest wildcard is the state’s growing Hispanic population, concentrated in the Upstate and along the coast, which is currently voting Republican at higher rates than in other Southern states but could shift as national politics evolve. For a new resident, expect the state to remain a low-tax, limited-government environment, but with increasing cultural friction in the fast-growing metros.
For someone moving to South Carolina, the bottom line is this: if you’re conservative, you’ll find a state that largely aligns with your values on taxes, guns, education, and family policy. If you’re liberal, you’ll find a state that is less hostile than some of its neighbors—you can live comfortably in Charleston or Columbia without feeling politically isolated, but you’ll need to accept that state-level policy will often run counter to your preferences. The practical takeaway is that your experience will depend heavily on where you land: the rural Lowcountry is a different world from the tech hubs of the Upstate, and the coast is a different world from the Midlands. Choose your county carefully, because in South Carolina, local politics still matter a great deal.
* Values derived from national, state, county, city and local statistics and may differ in a specific area. Last updated: 2026-06-14T19:30:25.000Z
Narrative content on this page is AI-generated and may contain mistakes. Verify any details that matter before acting on them.
ReloMaps may earn a commission from affiliate links at no extra cost to you.

