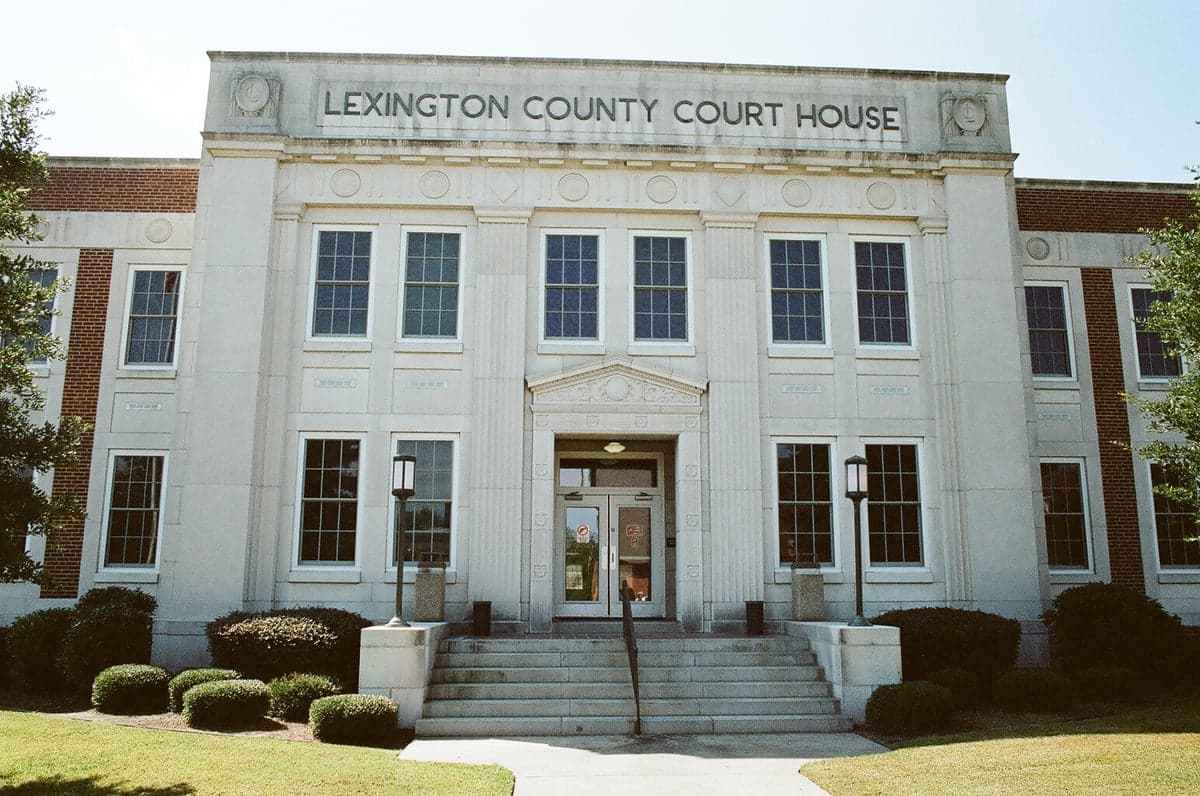
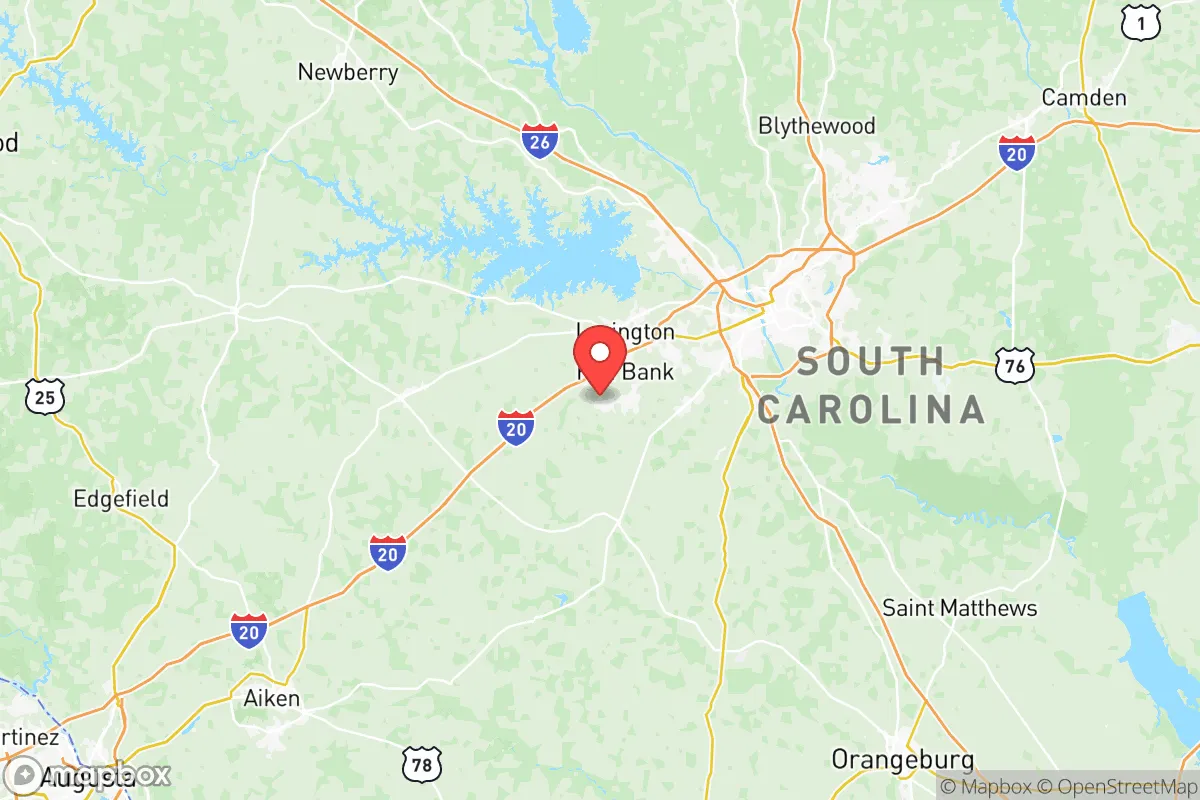
Photo: Wikipedia
Find The Best Places To Live in Lexington County
PRO TIP! You can paste a Zillow or Redfin link to get info on that property.
Best Places to Live in Lexington County
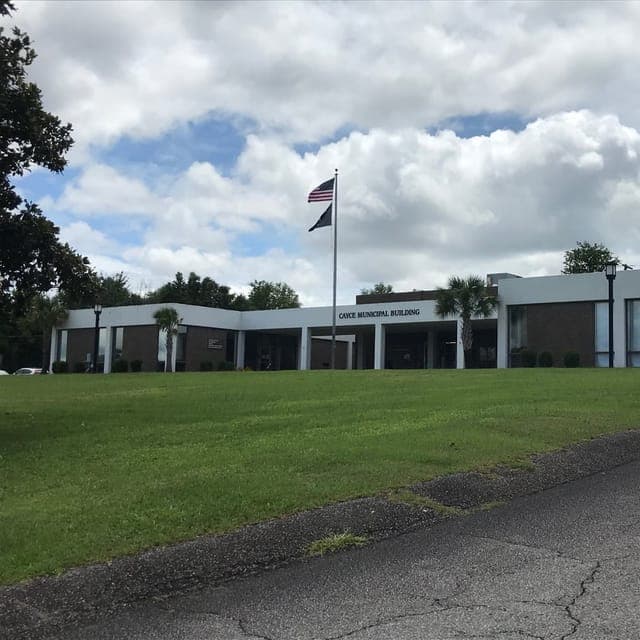

Cities & Towns in Lexington County
Cities in Lexington County
What It's Like Living in Lexington County, SC
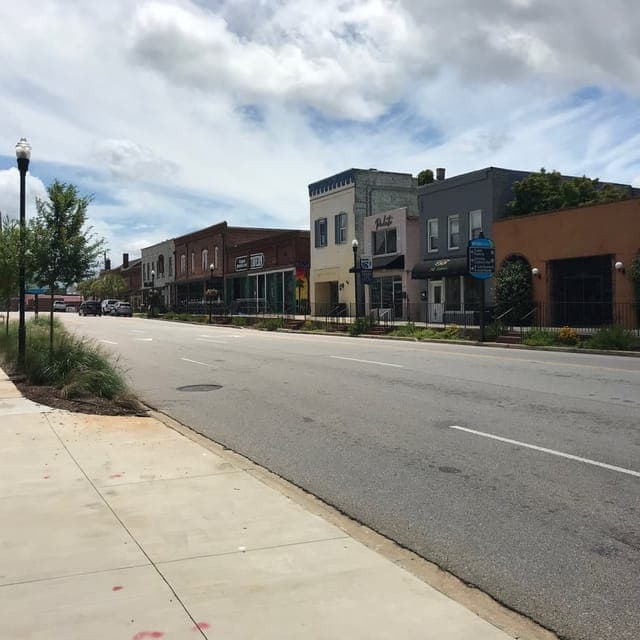
Lexington County feels like the part of South Carolina where the suburbs stop pretending to be rural and the small towns hold their own against the sprawl of Columbia. It’s a place where you can live in a neighborhood off I-20 in Lexington proper, drive 15 minutes to a lake house on Lake Murray, and still be at a high school football game in Batesburg-Leesville on a Friday night without feeling like you crossed state lines. The county’s identity is rooted in a practical, family-first conservatism—people here value good schools, low taxes, and a weekend schedule built around youth sports, church, and the lake.
Daily Rhythm: From the Lake to the Ballfield
For most residents, the week revolves around work commutes that average about 26 minutes—long enough to finish a podcast, short enough to still make it home for dinner. The biggest employment anchors are the county government, Lexington Medical Center, and the sprawling industrial parks near West Columbia and Cayce. A lot of people also commute into Columbia proper, but they choose Lexington County specifically to avoid Richland County’s higher taxes and city-school headaches. After work, the action shifts to the lake. Lake Murray dominates summer evenings and weekends: families pile into pontoons at Dreher Island State Park, teenagers cliff-jump at the dam, and the Lexington waterfront fills with couples grabbing dinner at Liberty on the Lake or the laid-back Tavern on the Lake. When the weather cools, Friday nights belong to high school football. Lexington High School’s Wildcats and Chapin High’s Eagles draw crowds that rival some small colleges, and the rivalry between Lexington and White Knoll is a genuine community event—not just a game.
Sports, Festivals, and the Local Hangouts
There’s no pro sports team in the county, but the University of South Carolina Gamecocks in nearby Columbia are the de facto local team. On fall Saturdays, you’ll see garnet-and-black flags on trucks from Gilbert to Pelion. The biggest annual event is the Lexington County Peach Festival in July, which is exactly as Southern as it sounds—fried pies, a parade, and a pageant. For music, the Icehouse Amphitheater in downtown Lexington hosts free concerts and movie nights that draw families from all over the county. The food scene is improving but still leans heavily on chains and meat-and-three spots. Locals swear by Shealy’s Bar-B-Que in Batesburg-Leesville for buffet-style Southern cooking, and by the German-style beer garden at Bierkeller in West Columbia. For a night out, the small but walkable Main Street in Lexington has a few breweries and cocktail bars, but most people end up at a friend’s lake house or a backyard fire pit.
Who Fits In—and Who Doesn’t
This county works best for people who want a slower pace without total isolation. The median age is 39.7, and the median household income of $75,014 supports a comfortable middle-class lifestyle—especially since the cost of living index sits at 88, well below the national average. A median home value of $217,700 means a teacher or a nurse can actually buy a house here, which is increasingly rare in the Southeast. The kind of person who thrives here is someone who doesn’t mind driving 20 minutes to a good restaurant, who wants their kids in a school system where the PTA is more active than the city council, and who sees a Saturday morning at a Chapin farmers market as a highlight. The trade-off is that if you’re looking for urban energy, late-night culture, or significant ethnic diversity (the county is about 75% white), you’ll feel the limits. The violent crime rate of 372.5 per 100,000 is higher than the national average, though it’s concentrated in a few areas near Cayce and West Columbia; most of the suburban and rural towns feel very safe.
Pros and Cons of Living Here
- Pro: Affordable housing that actually lets you build equity. A family can buy a 3-bedroom in Lexington or Chapin for under $250,000 and still have money left for a boat payment.
- Pro: Lake Murray is a genuine recreational asset. Boating, fishing, and lakeside dining are part of daily life, not just vacation plans.
- Pro: The schools are a major draw. Lexington County School Districts 1 and 2 consistently rank among the state’s best, and they’re a big reason families move here from other parts of South Carolina.
- Con: Traffic on I-20 and I-26 is getting worse. The average commute of 26 minutes hides the fact that a fender bender can turn a 20-minute drive into an hour-long crawl.
- Con: Entertainment options are limited. If you want live music beyond cover bands, a diverse food scene, or any kind of nightlife past 10 p.m., you’re driving into Columbia or skipping the county altogether.
- Con: The summers are brutal. Humidity sits in the 90s from June through September, and the only relief is air conditioning or jumping in the lake—which is warm enough by August to feel like bathwater.
Lexington County doesn’t try to be what it’s not. It’s a place where people trade urban convenience for space, safety, and a sense of belonging. If you want a county where your neighbors wave from their driveways, your kids can play outside without you worrying, and your weekend plans revolve around a boat or a ballfield, this is it. Just don’t expect it to be anything else.

* Values derived from national, state, county, city and local statistics and may differ in a specific area. Last updated: 2026-06-14T19:30:25.000Z
Narrative content on this page is AI-generated and may contain mistakes. Verify any details that matter before acting on them.
ReloMaps may earn a commission from affiliate links at no extra cost to you.

