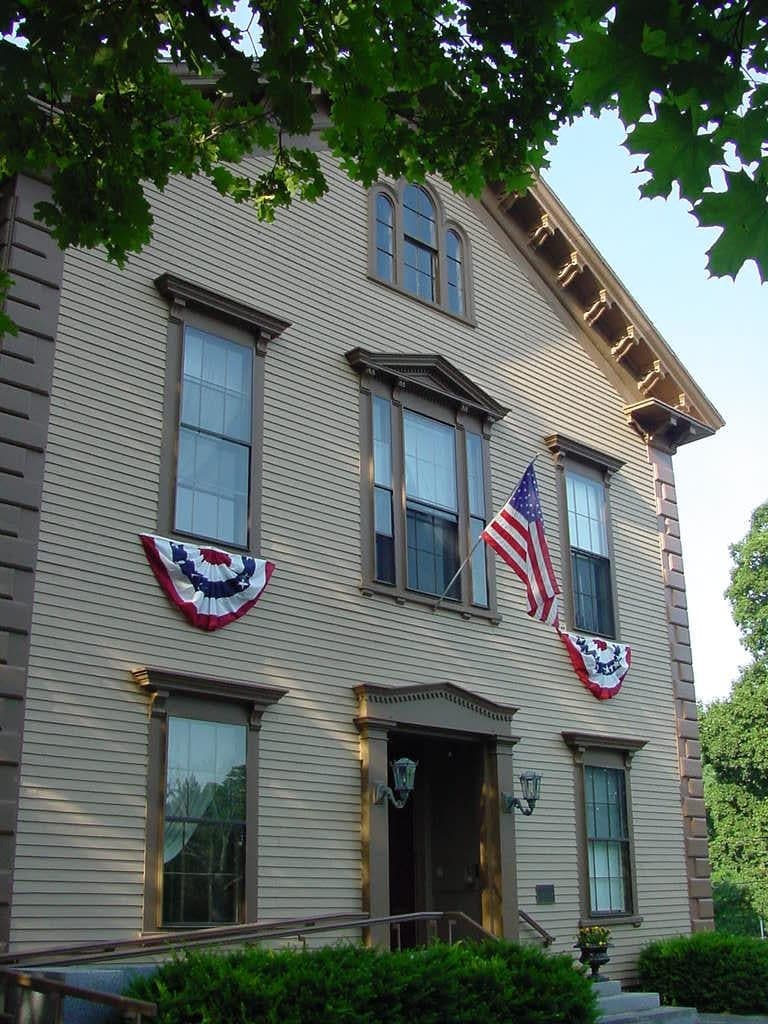
Photo: Wikipedia
Quality of Life in Sherborn, MA
A high quality of life with strong walkability, manageable living costs, healthy neighborhood signals, and solid amenity access.
What does Quality of Life tell us?
Quality of Life blends cost of living, nearby amenities, socioeconomic signals, and neighborhood character. City-level scores represent the whole municipality; individual neighborhoods can differ.
What does this tell us?
Quality of Life blends cost of living, nearby amenities, socioeconomic signals, and neighborhood character. City-level scores represent the whole municipality; individual neighborhoods can differ.
Cost of Living
153% above national average
The Real Cost of Living in Sherborn, MA for 2026
| Tier | Individual | Family (4) |
|---|---|---|
| Survival | $37k | $69k |
| Comfortable | $183k | $270k |
| Luxury | $433k+ | $671k+ |
| Elite (Top 5%) | $509k+ | $789k+ |
92%
The Area Signal
A metric tracking the socioeconomic signals of the area.
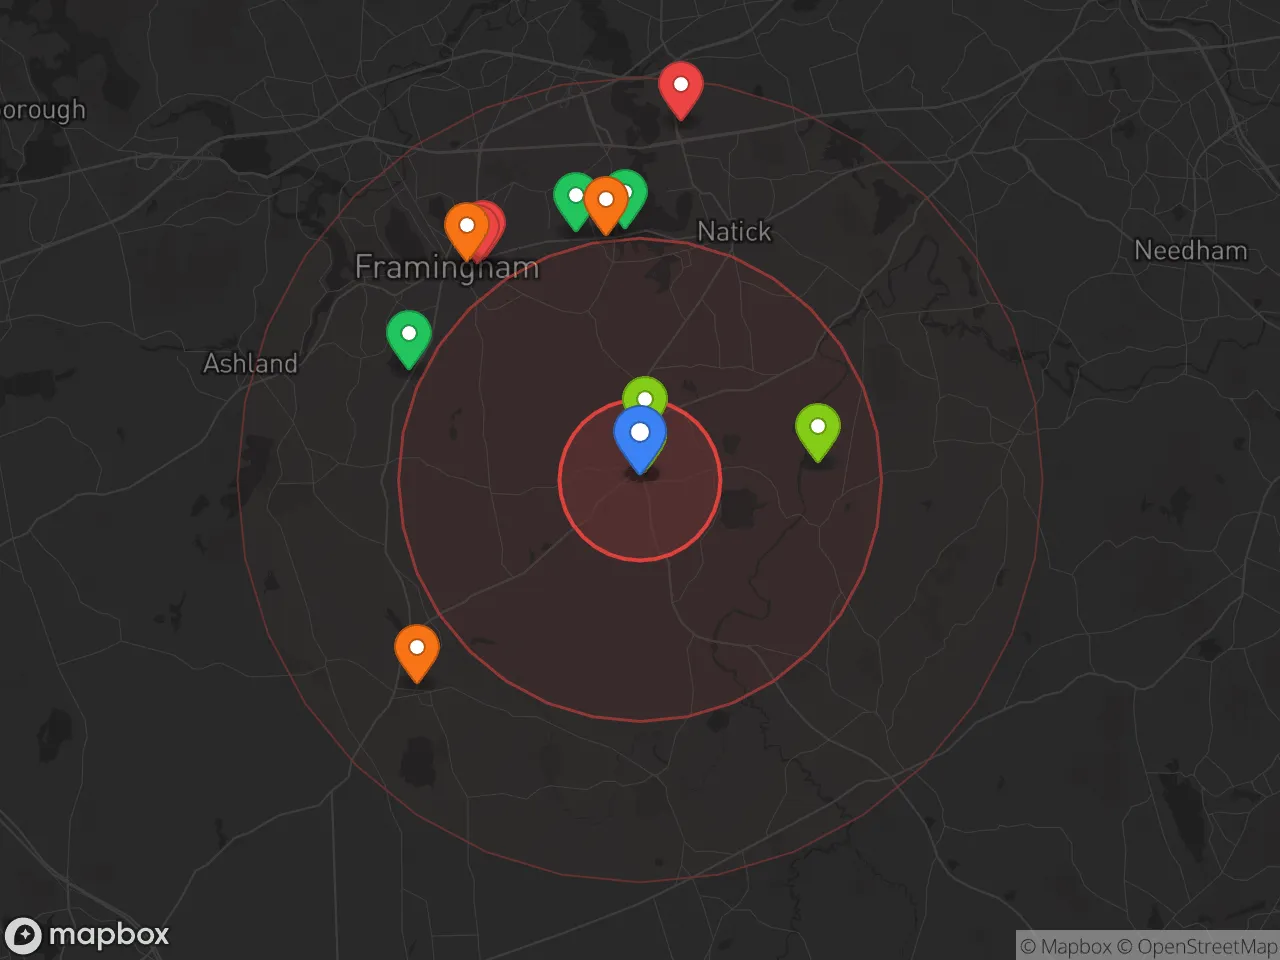
Hobbies
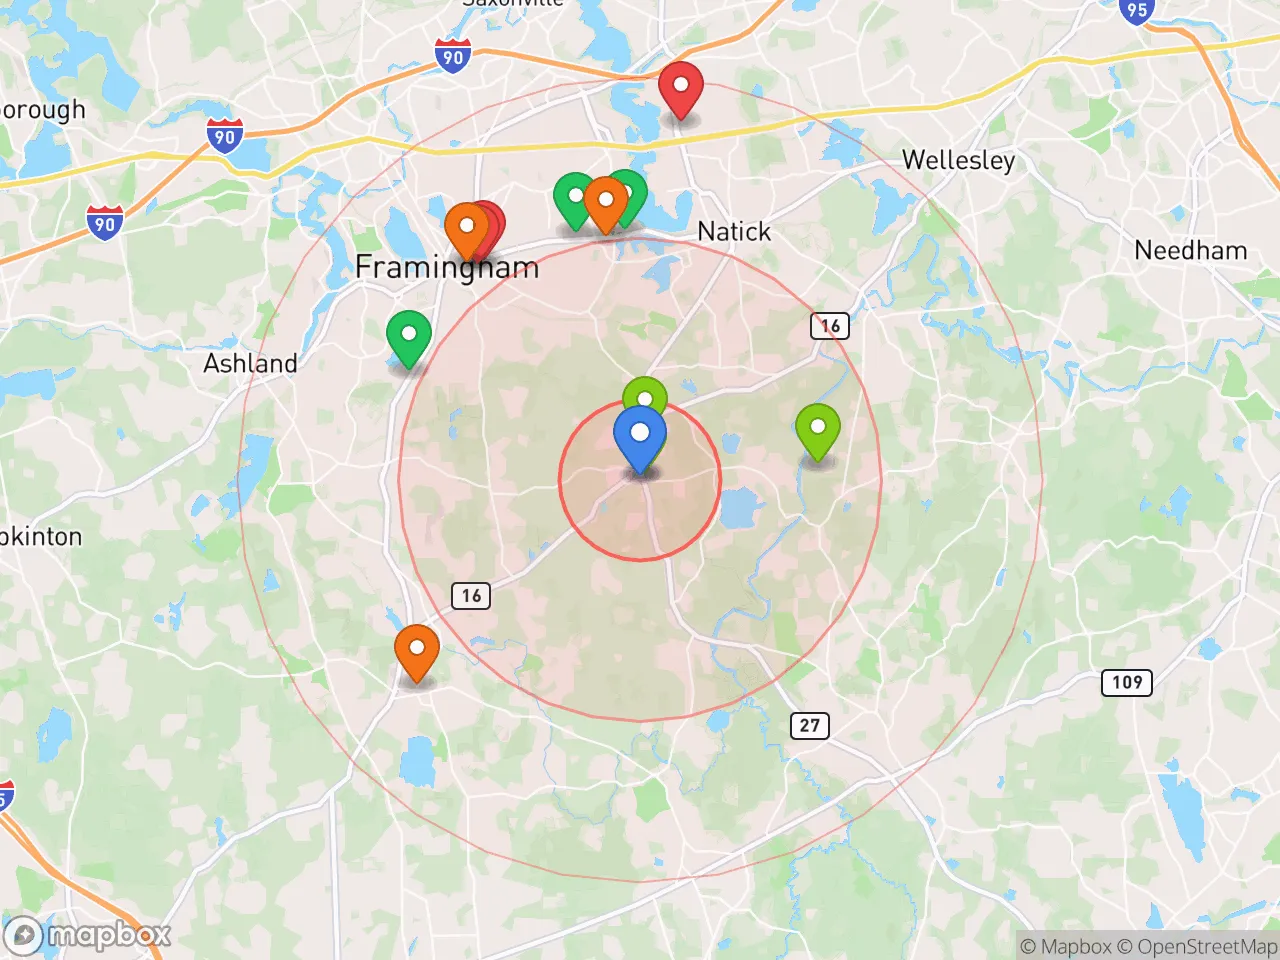
Explore the areaGroceries
0 within 10 miles
Gas
0 within 10 miles
Hospital
0 within 20 miles
Airport
PDX — Portland International Jetport
Post Office
Critical Amenities
Quality-of-Life Analysis
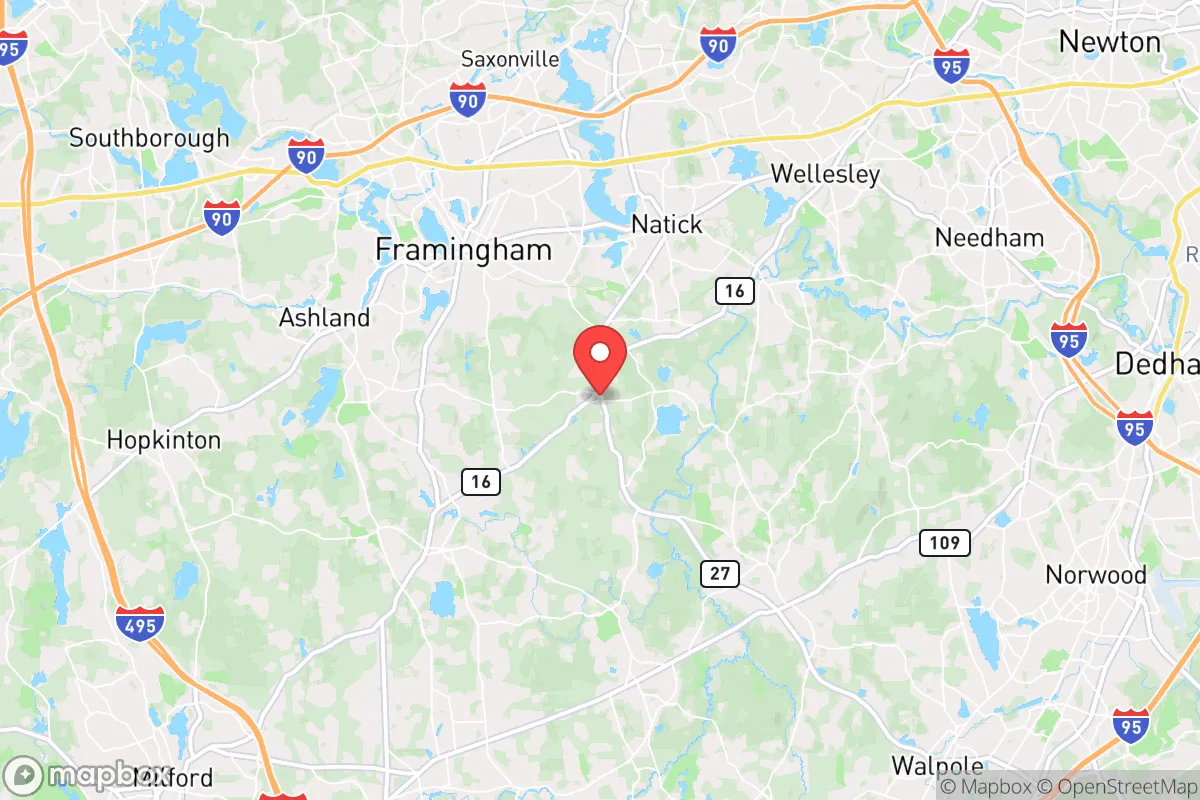
Sherborn, Massachusetts, is one of the most affluent communities in MetroWest, with a cost of living index of 253—more than two and a half times the national average—placing it among the top 5% most expensive towns in the state. The roughly 4,200 residents are predominantly professionals, executives, and entrepreneurs drawn by the town's rural character, top-tier public schools, and proximity to Boston. With no downtown commercial district, Sherborn is a quiet, land-rich enclave where large-lot zoning (minimum 2 acres) and strict conservation bylaws preserve a horse-farm-and-forest landscape.
Cost of living, housing, and affordability compared to nearby towns
Sherborn's median home value of $944,400 is roughly 30% higher than the MetroWest average and nearly double the Massachusetts median of about $520,000. The median rent of $2,313, while high, is actually below the Boston metro median of $2,800, reflecting the town's limited rental stock—only about 5% of housing units are renter-occupied. Compared to adjacent towns, Sherborn is pricier than Holliston (median home ~$720,000) and Millis (~$650,000) but slightly less expensive than Dover ($1.2M+) and Weston ($1.5M+). The average commute of 30 minutes is notably shorter than the Boston metro average of 33 minutes, a practical advantage for residents working in Framingham, Natick, or the Longwood Medical Area. Property taxes, at roughly $12,500 annually on the median home, are moderate for the region, though the town's lack of commercial tax base means residential rates (about $13.20 per $1,000 of assessed value) are higher than in commercial-heavy neighbors like Framingham.
What daily life is like for families: schools, amenities, and community rhythm
Sherborn's public schools are the primary draw: Pine Hill Elementary and Dover-Sherborn Middle and High Schools consistently rank in the top 10% of Massachusetts schools, with a 98% graduation rate and average SAT scores exceeding 1300. The town has no grocery store, pharmacy, or gas station—residents drive 5–10 minutes to Holliston, Millis, or Natick for errands. The community's rhythm revolves around outdoor recreation: the 600-acre Sherborn Town Forest, Rocky Narrows Reservation along the Charles River, and the 12-mile Sherborn Rail Trail provide hiking, mountain biking, and horseback riding. The Sherborn Library, with its active children's programs, and the annual Sherborn Community Day in September serve as social anchors. Dining and nightlife are virtually nonexistent within town limits; for restaurants and entertainment, residents head to Natick's Golden Triangle (15 minutes) or downtown Framingham (12 minutes). The town's strict zoning and conservation commission—which has preserved over 1,500 acres of open space—mean development is minimal, and the population has grown less than 3% since 2010.
Sherborn is best suited for families and professionals who prioritize school quality, privacy, and access to nature over urban conveniences. The high cost of entry and limited rental options make it impractical for young renters or first-time buyers without substantial income. Empty-nesters and retirees who value quiet, walkable neighborhoods may find the car-dependent layout and lack of services frustrating. For those who can afford it—particularly dual-income households earning $200,000+—Sherborn offers a rare combination of top-tier education, low crime rates (violent crime is near zero), and a 30-minute commute to Boston's job centers that is hard to match in any comparably priced suburb west of the city.

Crime in Sherborn, MA
Lower crime rates than 97% of comparable U.S. locations.
Violent CrimeViolent Crime Analysis
Property CrimeProperty Crime Analysis
Crime Analysis
Sherborn, Massachusetts, is one of the safest communities in the state, with a violent crime rate of just 22.2 incidents per 100,000 residents and a property crime rate of 111.2 per 100,000. These figures place Sherborn far below both the Massachusetts state average and the national median, reflecting a community where serious crime is exceptionally rare. However, as a small, affluent town within commuting distance of Boston, its safety profile is influenced by its proximity to a large metropolitan area where progressive criminal justice policies can create broader regional risks.
Crime in context
Sherborn’s violent crime rate of 22.2 per 100,000 is roughly one-tenth the national average of approximately 380 per 100,000, and well below the Massachusetts state rate of around 300 per 100,000. Property crime in Sherborn, at 111.2 per 100,000, is similarly low—about one-fifth the national rate of 1,954 per 100,000 and significantly under the state average of roughly 1,100 per 100,000. These numbers are consistent with Sherborn’s character as a low-density, primarily residential town with strong community cohesion and limited commercial activity that might attract crime.
What residents experience
For Sherborn residents, crime is not a daily concern. The town’s police department reports that the vast majority of calls involve minor issues such as traffic violations, noise complaints, or suspicious vehicles rather than violent offenses. Theft and burglary are infrequent, and when they occur, they often target unlocked vehicles or seasonal properties rather than occupied homes. Residents benefit from a robust neighborhood watch culture and a police force that maintains high visibility. However, it is important to note that Sherborn sits within the broader Metro Boston region, where progressive district attorneys and judges in neighboring counties have implemented policies such as cash bail reform, reduced prosecution of certain property crimes, and diversion programs for repeat offenders. While these policies do not directly affect Sherborn’s low crime rates, they can result in criminals from nearby urban centers being released back onto the streets, potentially increasing the risk of property crime in outlying suburbs like Sherborn.
Neighborhood-level variation
Sherborn is a small town of roughly 4,000 residents, and its crime rates are uniformly low across all neighborhoods. There are no statistically significant pockets of higher crime within the town limits. The most notable variation is seasonal: summer months see a slight uptick in property crime, particularly thefts from vehicles parked at trailheads or near the Sherborn Community Center. The town’s rural character—with many homes set back from the road on large lots—can make some properties feel isolated, but this has not translated into elevated crime rates. For residents seeking maximum security, neighborhoods closer to the town center or along main roads like Route 27 offer slightly more visibility and quicker police response times, though the difference is marginal. Overall, Sherborn’s safety record is exceptional, but its location within a region with lenient criminal justice policies warrants ongoing awareness from homeowners.
* Values derived from national, state, county, city and local statistics and may differ in a specific area. Last updated: 2026-11-09T06:04:24.000Z
Narrative content on this page is AI-generated and may contain mistakes. Verify any details that matter before acting on them.
ReloMaps may earn a commission from affiliate links at no extra cost to you.

