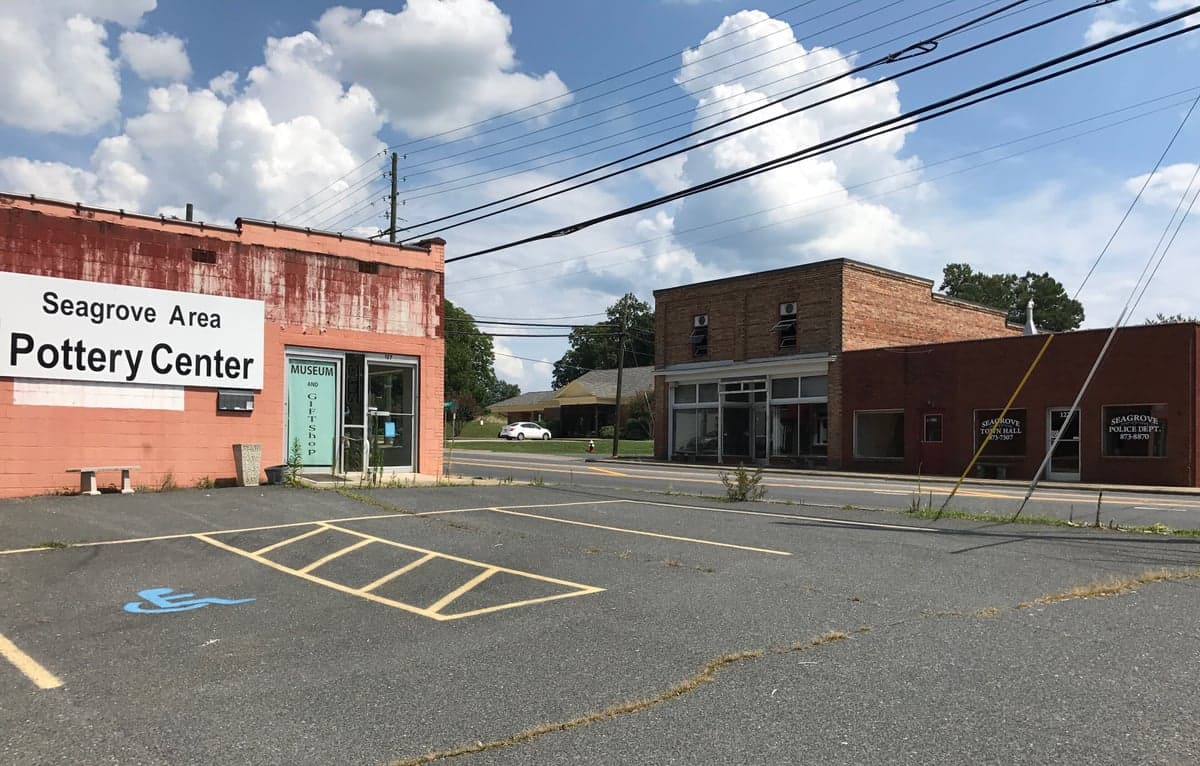
Photo: Wikipedia
Demographics of Seagrove, NC
Affluence Level in Seagrove, NC
A middle-class area roughly in line with national averages across income, home values, education, and employment.
People of Seagrove, NC
The people of Seagrove, North Carolina today number just 347 residents, making it one of the state’s smallest incorporated towns. The population is overwhelmingly White (93.4%) with a small Hispanic minority (3.5%) and no recorded Black, Asian, or Indian residents; 0.0% of the population is foreign-born. This is a deeply rooted, native-born community where pottery craftsmanship has defined local identity for generations, and the town remains a tight-knit, family-oriented enclave in rural Randolph County.
How the city was settled and grew
Seagrove’s human history begins with the discovery of high-quality clay deposits in the region, which drew English and Scotch-Irish potters in the late 18th and early 19th centuries. These early settlers established small farms and pottery workshops along the creeks and ridges, forming the nucleus of what would become the Pottery District — the historic core of town where many original kilns and family-run studios still operate. By the mid-1800s, the community had grown slowly around a crossroads, with families like the Teagues, Colemans, and Owens passing down wheel-throwing techniques through generations. The Seagrove Village area, centered on the main highway (NC 705), became the commercial and social hub, housing general stores, a school, and churches. No major immigrant waves arrived; the population remained almost entirely native-born White, sustained by agriculture and the region’s distinctive pottery trade. The town was formally incorporated in 1921, but its character had already been set: a rural, self-reliant community of artisans and farmers.
Modern era (post-1965)
After the 1965 Immigration and Nationality Act, Seagrove saw no significant influx of foreign-born residents — the foreign-born share remains 0.0% today. Domestic migration patterns also remained modest. The North Seagrove area, along the northern edge of town, saw limited subdivision development in the 1970s and 1980s, attracting families from elsewhere in Randolph County who wanted a quieter, land-based lifestyle. Meanwhile, South Seagrove stayed predominantly rural, with larger farm tracts and scattered pottery studios. The Hispanic population, now 3.5%, began appearing in the 1990s and 2000s, largely drawn by agricultural labor and construction work; these families settled primarily in mobile home parks and rental properties on the outskirts, such as the Pine Ridge area. However, the overall racial composition shifted very little: White share remained above 90%, and no Black, Asian, or Indian communities formed. The college-educated share (28.4%) reflects a modest but growing number of residents who commute to jobs in Asheboro, Greensboro, or work remotely while maintaining the town’s pottery heritage.
The future
Seagrove’s population is projected to remain small and stable, with little demographic diversification on the horizon. The town lacks the employment base or housing stock to attract large numbers of new residents; most growth will come from natural increase and a trickle of domestic in-migrants seeking a rural, craft-oriented lifestyle. The Hispanic share may inch upward as farm labor demand persists, but the foreign-born population is likely to stay negligible. Newer residential lots in Lake View, a small lakefront subdivision on the town’s eastern edge, have attracted some retirees and second-home buyers, but these are overwhelmingly White and native-born. The cultural identity of Seagrove will continue to revolve around its pottery tradition, with the Pottery District remaining the symbolic and economic heart. Over the next 10–20 years, the town will likely become slightly older and slightly more educated, but not meaningfully more diverse.
For someone moving in now, Seagrove offers a stable, predominantly White community with deep roots in American craft heritage. It is not a place of rapid change or demographic flux; it is a place where family names and pottery recipes have been passed down for two centuries. Newcomers will find a welcoming but insular environment, where fitting in means respecting the town’s traditions and pace of life.

* Values derived from national, state, county, city and local statistics and may differ in a specific area. Last updated: 2026-10-11T22:42:40.000Z
Narrative content on this page is AI-generated and may contain mistakes. Verify any details that matter before acting on them.
ReloMaps may earn a commission from affiliate links at no extra cost to you.

