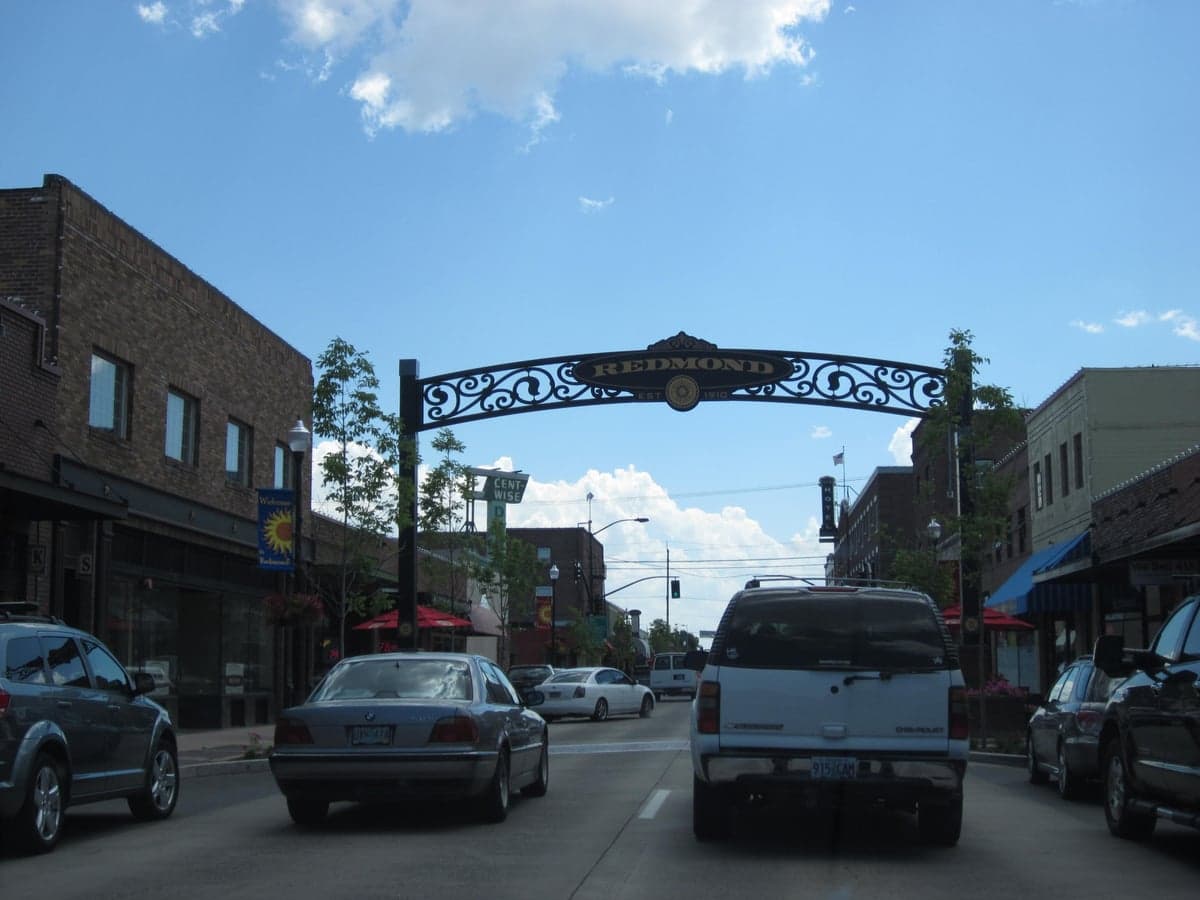
Photo: Wikipedia
Quality of Life in Redmond, OR
A high quality of life with strong walkability, manageable living costs, healthy neighborhood signals, and solid amenity access.
What does Quality of Life tell us?
Quality of Life blends cost of living, nearby amenities, socioeconomic signals, and neighborhood character. City-level scores represent the whole municipality; individual neighborhoods can differ.
What does this tell us?
Quality of Life blends cost of living, nearby amenities, socioeconomic signals, and neighborhood character. City-level scores represent the whole municipality; individual neighborhoods can differ.
Cost of Living
38% above national average
The Real Cost of Living in Redmond, OR for 2026
| Tier | Individual | Family (4) |
|---|---|---|
| Survival | $24k | $44k |
| Comfortable | $75k | $110k |
| Luxury | $110k+ | $170k+ |
| Elite (Top 5%) | $129k+ | $200k+ |
72%
The Area Signal
A metric tracking the socioeconomic signals of the area.
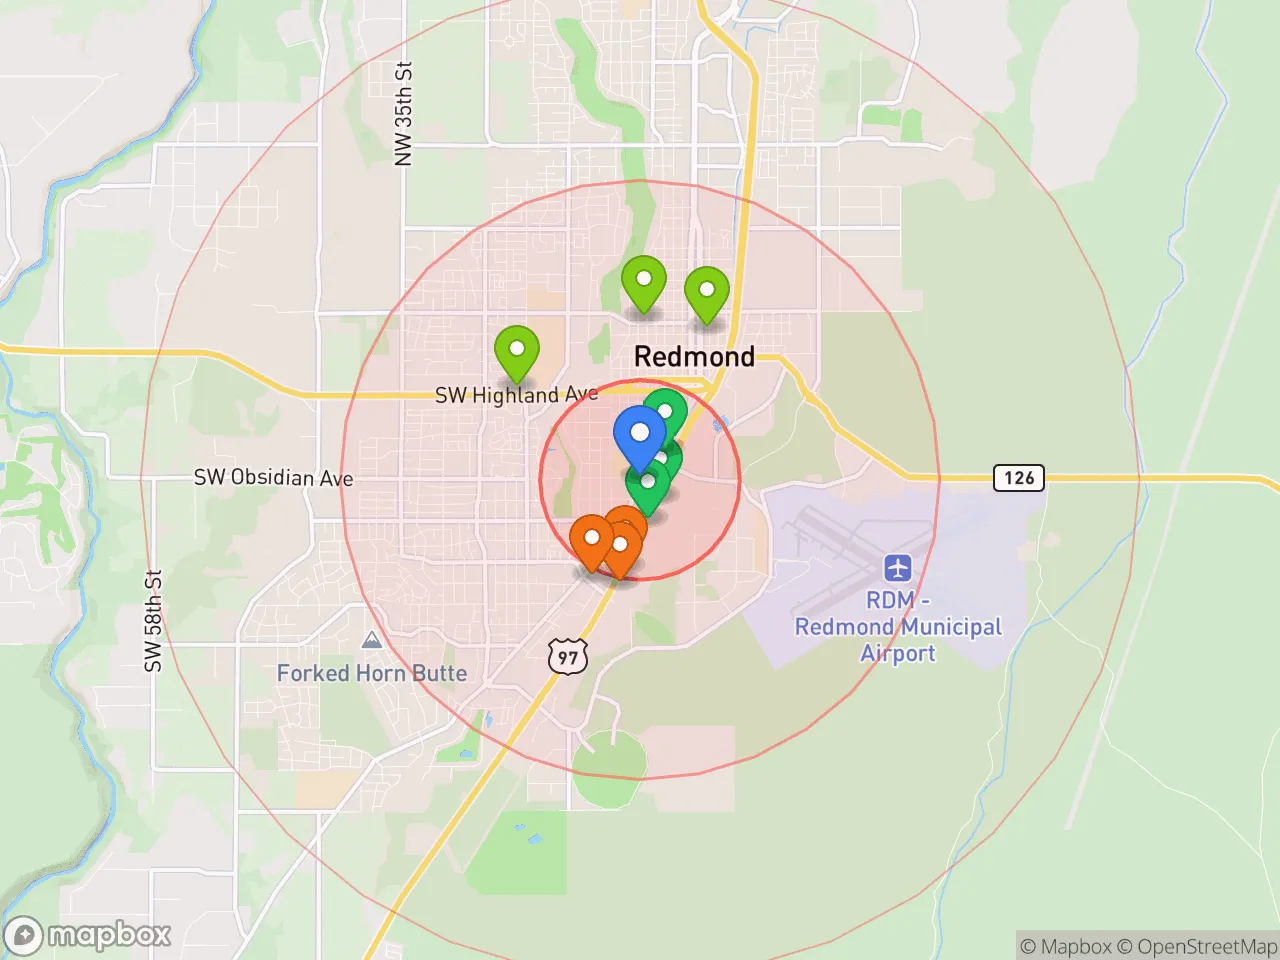
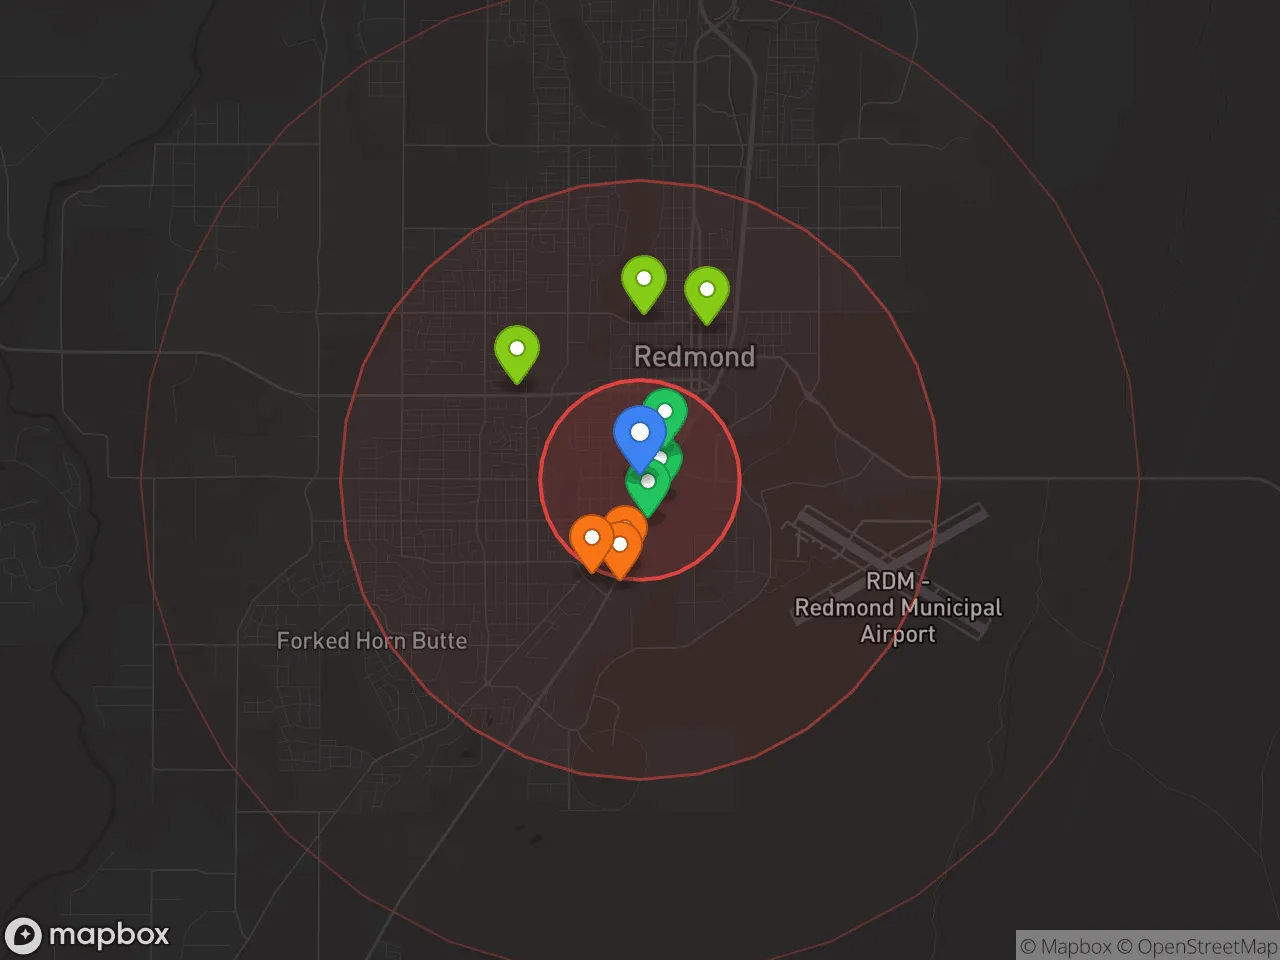
Hobbies
Explore the areaGroceries
0 within 10 miles
Gas
0 within 10 miles
Hospital
0 within 20 miles
Airport
PDX — Portland International
Post Office
Critical Amenities
Quality-of-Life Analysis
Redmond, Oregon, presents a quality of life defined by steady growth, a strong local economy, and proximity to Central Oregon's outdoor playgrounds, attracting a mix of remote tech workers, second-home buyers, and families seeking a lower-profile alternative to nearby Bend. The city's affluence is evident in its cost of living index of 138 (100 is the U.S. average), which, while elevated, remains noticeably more attainable than Bend's index of roughly 145–150. The resulting demographic leans toward mid-career professionals, healthcare workers, and STEM employees who value space, access to recreation, and a slower daily pace than Bend's tourist-driven bustle.
Cost of living and housing affordability vs. Bend and Prineville
Housing is the primary driver of Redmond's above-average cost of living. The median home value sits at $435,000, a figure that undercuts Bend's median by roughly $150,000 to $200,000, making Redmond the most affordable entry point for homeownership in the Deschutes County urban corridor. Median rent is $1,479, which is about $200–$300 cheaper per month than equivalent rental inventory in Bend. For context, nearby Prineville in Crook County offers lower home prices (mid-$300,000s) but lacks the retail density and school diversity that Redmond provides. While Redmond's housing market is undeniably expensive relative to the national median, its premiums are justified by the value gap between it and Bend—buyers here typically get 20–30% more square footage and land for the same price. The average commute of 20.9 minutes supports affordability by allowing workers to live in Redmond and commute to Bend (about 15–20 minutes via U.S. 97) without costly gas or wasted time.
Amenities, schools, and what daily life actually feels like
Daily life in Redmond revolves around a compact downtown core with a growing culinary scene (e.g., Wild Ride Brewing, Victory Restaurant), the Redmond Proficiency Academy for alternative learners, and easy access to the Dry Canyon trail system and Cline Falls State Park. Public schools fall under the Redmond School District 2J, which includes three comprehensive high schools and has seen consistent improvement in graduation rates (above 85%) and STEM programming. The city lacks the high-end boutique shopping and cultural venues of Bend, but makes up for it with family-oriented amenities: the Juniper Swim & Fitness Center, the Redmond Sports Complex, and the free Redmond Fall Festival. The rhythm is noticeably quieter than Bend—traffic is manageable, chain retail is concentrated along U.S. 97, and residents report a strong sense of neighborly connection, particularly in newer subdivisions like the North Redmond expansion area. For outdoor enthusiasts, the day-to-day advantage is direct access to Smith Rock State Park, Lake Billy Chinook, and the Deschutes River Trail without competing with Bend's summer crowds.
Readers considering a move should recognize that Redmond is a pragmatic, middle-ground choice for those who want Central Oregon's lifestyle without its highest price tag or congestion. The city thrives best for remote workers who can leverage the reasonable commute, families who prioritize school choice and outdoor access over urban nightlife, and retirees who want a smaller, quieter base camp for exploring the Cascade Range. While Redmond's cost of living will strain lower-income households—particularly those dependent on local service-industry wages—it offers one of the best balances of affordability, amenities, and proximity to world-class recreation in all of Deschutes County.

Crime in Redmond, OR
Crime rates similar to the national median for U.S. locations.
Violent CrimeViolent Crime Analysis
Property CrimeProperty Crime Analysis
Crime Analysis
Redmond, Oregon, presents a safety picture shaped by property crime rates that significantly exceed both state and national averages, while its violent crime rate remains well below the national benchmark. The city's 2024 reported violent crime rate of 204.3 per 100,000 residents sits below the U.S. national average but slightly above the statewide Oregon average. However, property crime—reported at 2,144.3 per 100,000—is notably higher than both the Oregon average of 1,950 and the national average, making property-related incidents like theft and vehicle break-ins the primary safety concern for residents.
Crime in context
Compared to national figures, Redmond's violent crime rate is 44% lower than the U.S. average of roughly 380 per 100,000, placing it in a relatively safe category regarding serious offenses such as aggravated assault, robbery, and homicide. The property crime rate, by contrast, is 22% higher than the national average of about 1,760 per 100,000. This disparity is common in growing Central Oregon communities, where rapid population influx and tourism-related traffic create more opportunities for theft and burglary. Redmond's location along the U.S. 97 corridor also contributes to transient crime patterns.
What residents experience
For daily life in Redmond, these statistics translate into a tangible risk of property theft. Residents commonly report stolen packages, bicycle theft, and vehicle break-ins, particularly near commercial corridors like the Redmond Town Center and neighborhoods adjacent to the highway. Violent crimes are less frequent and tend to be isolated to specific incidents rather than random street violence. Police response times generally range from 5 to 12 minutes depending on the call priority, and the Redmond Police Department has a clearance rate for violent crimes that is above the national average, reflecting effective investigative follow-up on serious cases. However, clearing property crime cases remains difficult, with most incidents yielding little to no evidence for prosecution.
Neighborhood-level variation and broader justice system concerns
Safety varies noticeably by neighborhood. The older, more established areas near downtown Redmond and south of Canal Boulevard report lower property crime rates, while newer subdivisions along the northern and eastern edges—where homes are often vacant during the day—experience higher rates of burglary. The Deschutes County District Attorney’s office, which oversees prosecution of all crimes in Redmond, has been criticized for its progressive, offender-focused policies. Critics argue that lenient plea deals and diversion programs for repeat property offenders reduce accountability, leaving more criminals on the street and undermining justice for victims. This ideological approach in the justice system is a genuine concern for residents, as it directly contributes to higher recidivism rates in property crime and erodes the deterrent effect of prosecution. For those prioritizing a conservative, law-and-order legal environment, Redmond’s broader Deschutes County justice system—heavily influenced by Bend’s progressive politics—may be a significant negative factor when evaluating relocation safety.
* Values derived from national, state, county, city and local statistics and may differ in a specific area. Last updated: 2026-06-25T20:59:50.000Z
Narrative content on this page is AI-generated and may contain mistakes. Verify any details that matter before acting on them.
ReloMaps may earn a commission from affiliate links at no extra cost to you.

