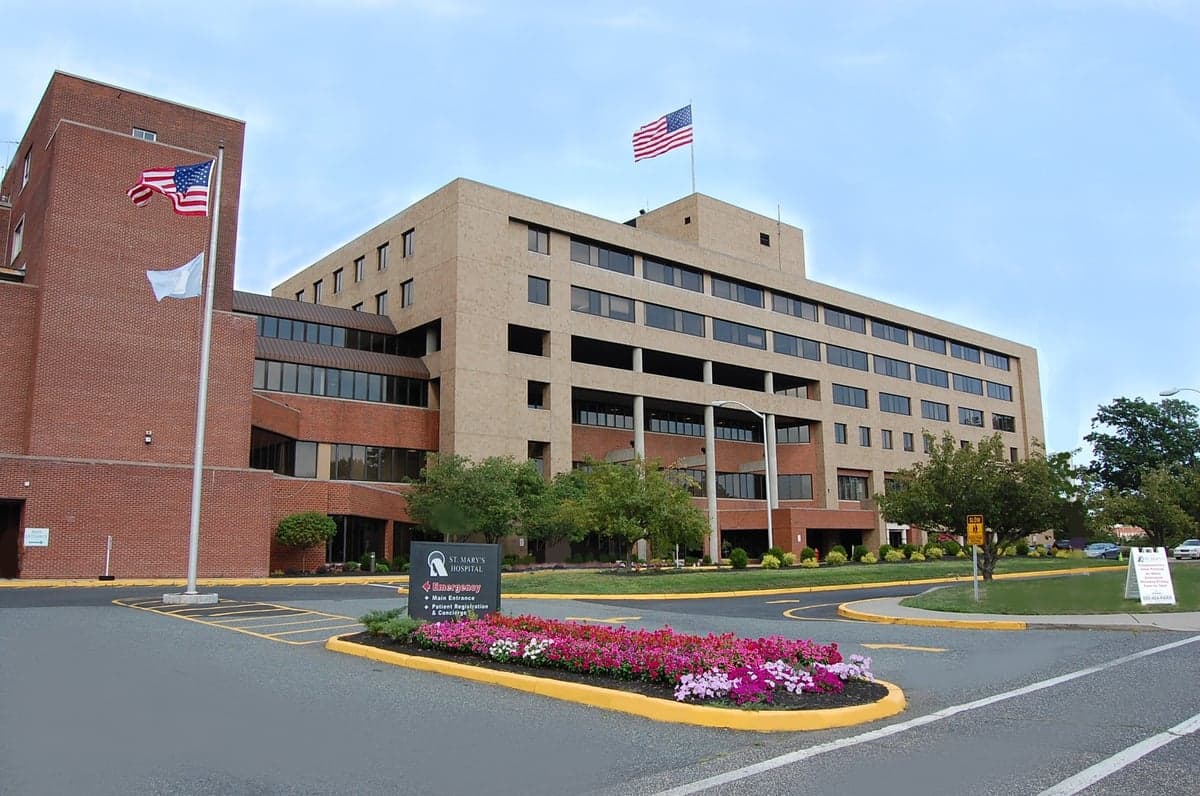
Photo: Wikipedia
Demographics of Passaic, NJ
Affluence Level in Passaic, NJ
A low-income area with significant economic hardship. Household wealth and educational attainment are well below national averages.
People of Passaic, NJ
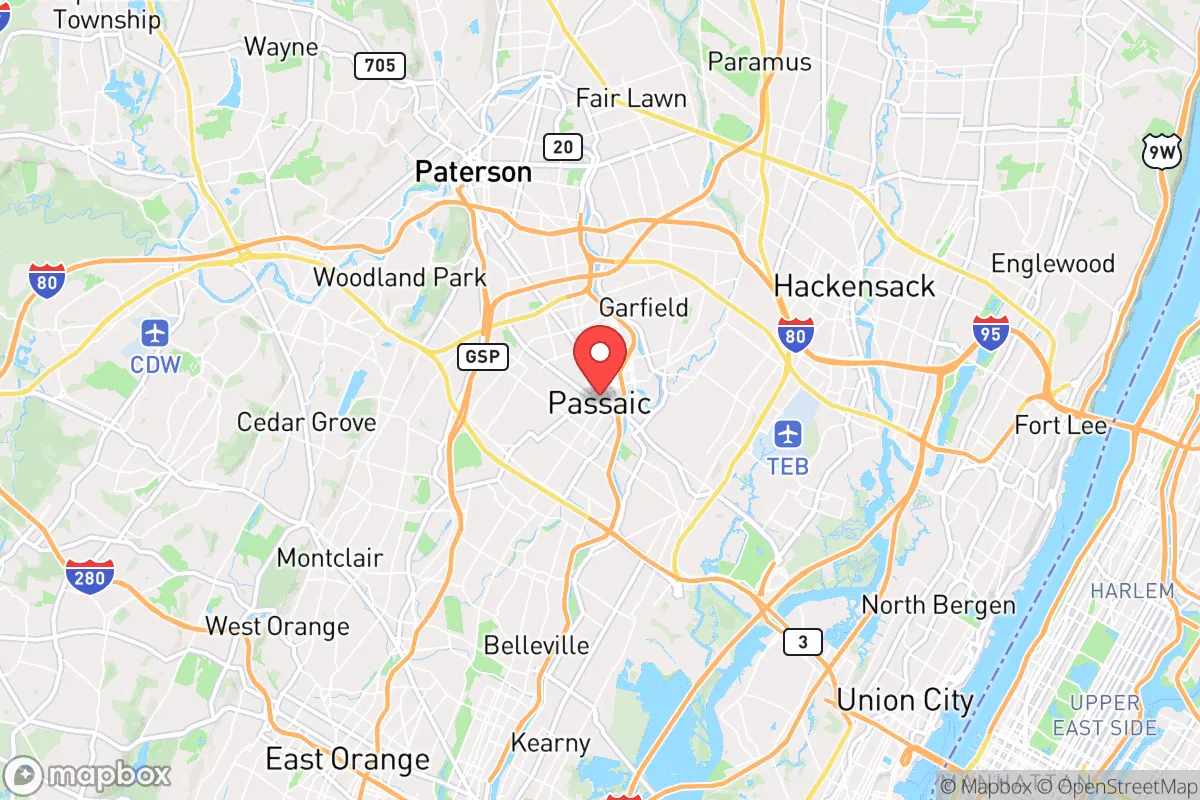
The people of Passaic, New Jersey, today form a dense, predominantly Hispanic city of 69,651 residents, where 73.0% of the population identifies as Hispanic and 26.6% are foreign-born. The city is characterized by its working-class character, high population density (over 17,000 people per square mile), and a distinctive identity as a gateway for successive waves of immigrants, each leaving a visible mark on its neighborhoods. With a low college attainment rate of 16.9%, Passaic remains a city where blue-collar labor and small-scale commerce define daily life, and where the cultural fabric is overwhelmingly shaped by its Dominican, Puerto Rican, and Central American communities.
How the city was settled and grew
Passaic’s population history begins with its industrial founding. The city was incorporated in 1873, but its growth exploded after the 1890s when the Passaic River’s water power attracted massive textile mills, rubber factories, and metalworks. The original workforce was drawn from German and Irish immigrants, who settled in the First Ward and Second Ward neighborhoods near the mills. By the early 1900s, Eastern European Jews and Italians arrived in large numbers, building dense tenement districts in the Third Ward and along Main Avenue. These groups established the city’s early ethnic parishes, synagogues, and mutual-aid societies. The 1910s and 1920s saw a wave of Polish and Slovak immigrants, who concentrated in the Gregory Avenue corridor and the area around Passaic High School. By 1930, the city’s population had surged past 60,000, making it one of the most densely populated municipalities in the United States. The Great Depression and post-war suburbanization thinned the population somewhat, but the industrial base—especially the Botany Worsted Mills and the Passaic Metal Works—kept the city a magnet for labor until the 1960s.
Modern era (post-1965)
The 1965 Hart-Cellar Immigration Act fundamentally reshaped Passaic’s population. Puerto Ricans, who were U.S. citizens and had been arriving since the 1950s, formed the first large Hispanic wave, settling in the First Ward and along Van Houten Avenue. By the 1970s, Dominican immigrants began arriving in force, drawn by factory jobs and existing Spanish-speaking networks. They concentrated in the Third Ward and the area around Monroe Street, where Dominican bodegas and churches now anchor the commercial life. Central Americans—particularly Guatemalans and Salvadorans—arrived in the 1980s and 1990s, fleeing civil wars, and settled in the Fourth Ward and near Passaic Park. The white population, which had been 98% as late as 1960, collapsed during this period. Today, non-Hispanic whites make up just 14.6% of the population. The Black population stands at 6.3%, a mix of African American families who arrived during the Great Migration and more recent Afro-Caribbean immigrants. East/Southeast Asian communities (0.9%) are a small presence, concentrated in a few blocks near Main Avenue and Passaic Street. Indian-subcontinent residents (3.8%) are a more visible minority, with a cluster of Gujarati-owned motels and convenience stores along Route 21 and in the Passaic Park neighborhood.
The future
Passaic’s population is becoming more, not less, Hispanic. The Hispanic share has risen from roughly 50% in 1990 to 73.0% today, and that trend is expected to continue as older non-Hispanic residents age out and younger Hispanic families have higher birth rates. The foreign-born share (26.6%) is likely to remain high, as the city continues to attract immigrants from the Dominican Republic, Guatemala, and Honduras. New communities are not concentrating in a single area but are dispersing across the city, though the First Ward and Third Ward remain the densest Hispanic enclaves. The Indian-subcontinent population, while small, is growing slowly, driven by the motel and taxi industries, and is likely to remain concentrated in Passaic Park. The East/Southeast Asian population is stable but tiny. The city’s cultural identity is evolving from a multi-ethnic industrial town into a predominantly Hispanic working-class city, with Spanish increasingly dominant in public life, storefronts, and schools. Over the next 10-20 years, Passaic will likely see continued Hispanic growth, a slow decline in the non-Hispanic white and Black shares, and a modest increase in the Indian-subcontinent population.
For someone moving in now, Passaic is a dense, affordable, and overwhelmingly Hispanic city where Spanish is the de facto language of commerce and community. It offers proximity to New York City via NJ Transit and a strong sense of neighborhood identity, but also faces challenges of low educational attainment, aging housing stock, and limited economic mobility. It is a city that remains a true immigrant gateway, but one where the character is now firmly set by its Dominican and Central American majority.

* Values derived from national, state, county, city and local statistics and may differ in a specific area. Last updated: 2026-06-14T02:06:34.000Z
Narrative content on this page is AI-generated and may contain mistakes. Verify any details that matter before acting on them.
ReloMaps may earn a commission from affiliate links at no extra cost to you.

