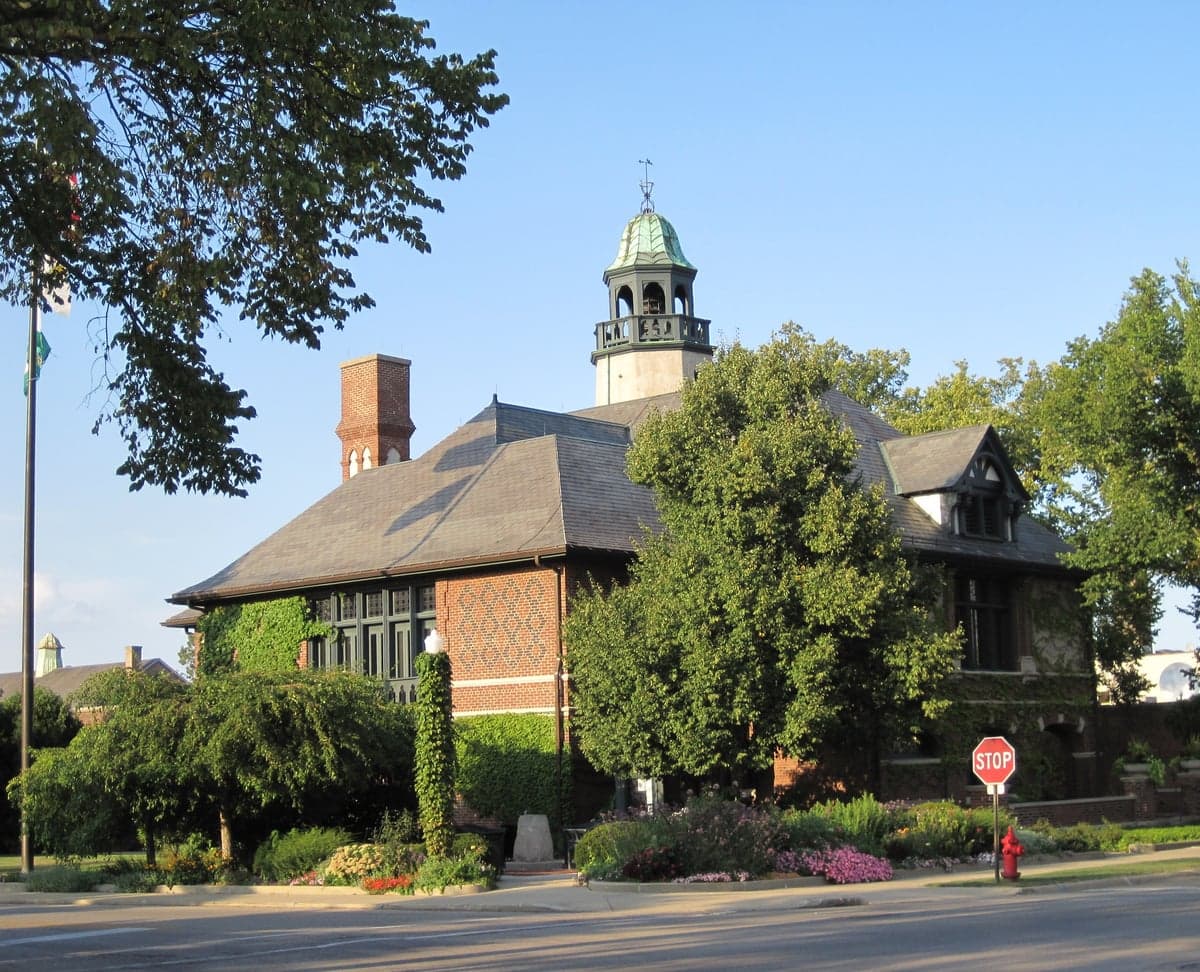
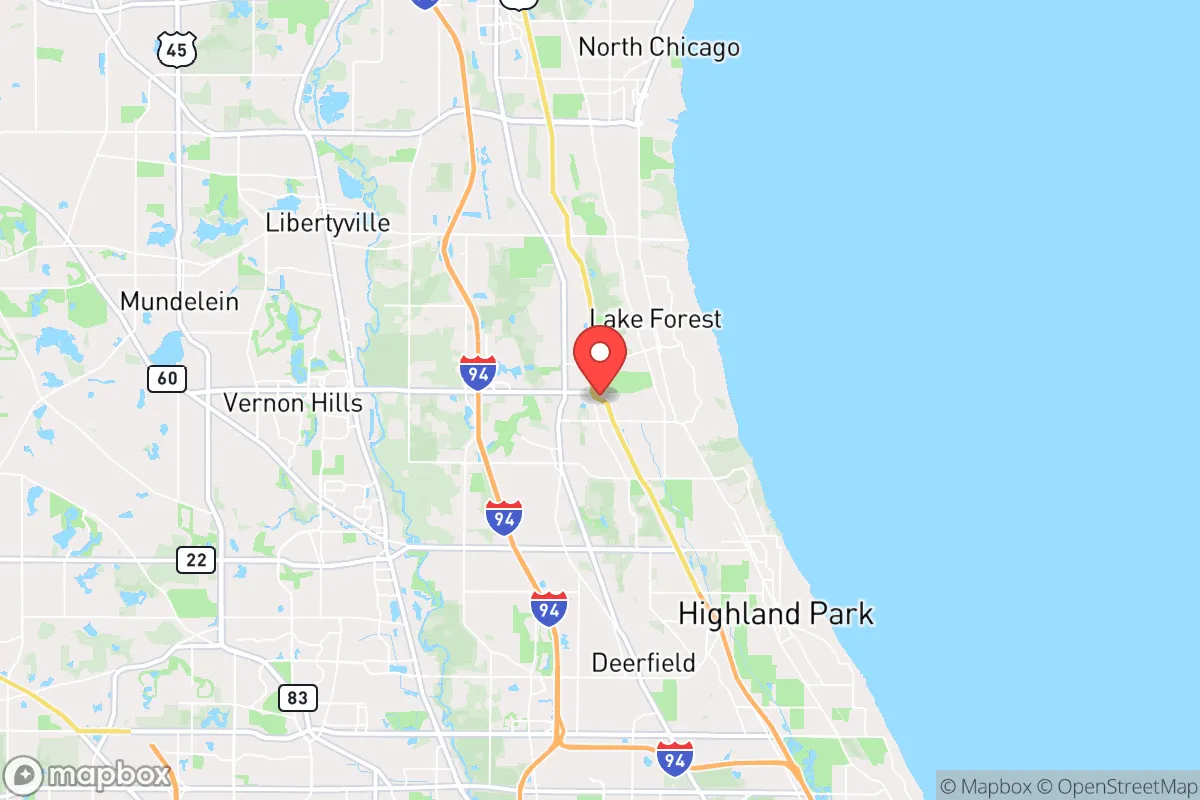
Photo: Wikipedia
Demographics of Lake Forest, IL
Affluence Level in Lake Forest, IL
A wealthy area with high-earning, well-educated households. Incomes, home values, and educational attainment meaningfully outpace national averages.
People of Lake Forest, IL
The people of Lake Forest, Illinois, today form an affluent, highly educated community of 19,190 residents, distinguished by a white population of 82.4% and a college attainment rate of 80.8%—among the highest in the Midwest. The city’s identity is shaped by deep-rooted old-money families, a strong preservationist ethos, and a growing but still modest diversity, with Hispanic residents at 4.7%, East/Southeast Asian residents at 3.8%, and Indian-subcontinent residents at 2.3%. Lake Forest remains a place where tradition and exclusivity are balanced by a deliberate, if gradual, demographic evolution.
How the city was settled and grew
Lake Forest was founded in 1857 as a planned residential community by a group of Presbyterian businessmen from Chicago, led by the Lake Forest Association. They sought a bucolic, moral, and exclusive retreat from the city’s industrial chaos, and the arrival of the Chicago and North Western Railway in 1855 made the commute viable. The original population was overwhelmingly Yankee Protestant—English, Scottish, and Northern Irish stock—who built grand estates along Sheridan Road and the lakefront. The first major wave of growth came in the 1870s–1890s, when Chicago’s elite (Armours, Swifts, Farwells) erected summer homes and year-round mansions in what is now the East Lake Forest Historic District, a neighborhood of tree-lined streets and sprawling lots. A second wave arrived in the 1910s–1930s, as the city’s reputation for elite education (Lake Forest College, founded 1857) and social prestige attracted wealthy professionals and industrialists. These families settled in the West Lake Forest area, where smaller but still substantial homes were built along Deerpath Road and Green Bay Road. The city’s growth was deliberately slow: zoning laws from the 1920s mandated large lots (minimum 1–3 acres in many areas), effectively filtering out working-class and immigrant populations. By 1950, Lake Forest was nearly 100% white, native-born, and Protestant, with a small Irish Catholic servant class living in the South Side neighborhood near the railroad tracks.
Modern era (post-1965)
The post-1965 era brought modest but meaningful demographic shifts. The Hart-Cellar Act of 1965 opened immigration from Asia and Latin America, but Lake Forest’s high housing costs and restrictive zoning limited the impact. The first non-white residents were primarily East/Southeast Asian professionals—Chinese and Japanese engineers and executives—who began moving into the Concordia Place area (near the Lake Forest College campus) and the Everett Estates subdivision in the 1980s and 1990s. Indian-subcontinent families, largely in medicine and technology, followed in the 2000s, concentrating in the newer West Lake Forest developments near Route 41. Hispanic residents, mostly of Mexican descent, arrived as service workers and landscapers, settling in the South Side and along the Rockland Road corridor, though their share remains low at 4.7%. The Black population, historically tiny (0.9%), has not grown significantly, as Lake Forest lacks the affordable housing stock that attracts Black middle-class families to nearby Waukegan or North Chicago. The city’s foreign-born population of 4.3% is well below the national average, reflecting its continued appeal to native-born, highly educated professionals who value the city’s reputation for safety, schools, and social homogeneity.
The future
Lake Forest’s population is slowly diversifying, but the pace is glacial. The East/Southeast Asian share (3.8%) and Indian-subcontinent share (2.3%) are expected to grow modestly as the city’s top-ranked public schools (Lake Forest High School, rated among Illinois’ best) attract tech and medical professionals from Chicago’s suburbs and beyond. The Hispanic population may increase slightly as service-sector families move into the South Side and Rockland Road areas, but the city’s median home value exceeding $1 million will continue to limit in-migration from lower-income groups. The white population, while still dominant, is aging: the median age is 47.5, and many long-time residents are retiring to warmer climates, opening homes for younger, more diverse buyers. The city’s cultural identity is evolving from a WASP enclave to a cosmopolitan but still exclusive community, where old-money traditions (the Lake Forest Day parade, the Lake Forest Garden Club) coexist with new residents from Asia and India. The next 10–20 years will likely see the East/Southeast Asian and Indian populations each reach 5–6%, while the white share declines to the mid-70s. The Black and Hispanic shares will remain low unless the city builds affordable housing, which faces strong political resistance.
For someone moving in now, Lake Forest offers a stable, safe, and prestigious environment with a population that is slowly becoming more diverse but remains overwhelmingly white and wealthy. The city is not a melting pot but a place where new residents—especially professionals from Asia and India—are welcomed into established neighborhoods like Everett Estates and West Lake Forest while the core identity of tradition, education, and exclusivity endures. It is a community in gentle transition, not transformation.

* Values derived from national, state, county, city and local statistics and may differ in a specific area. Last updated: 2026-10-29T16:04:16.000Z
Narrative content on this page is AI-generated and may contain mistakes. Verify any details that matter before acting on them.
ReloMaps may earn a commission from affiliate links at no extra cost to you.

