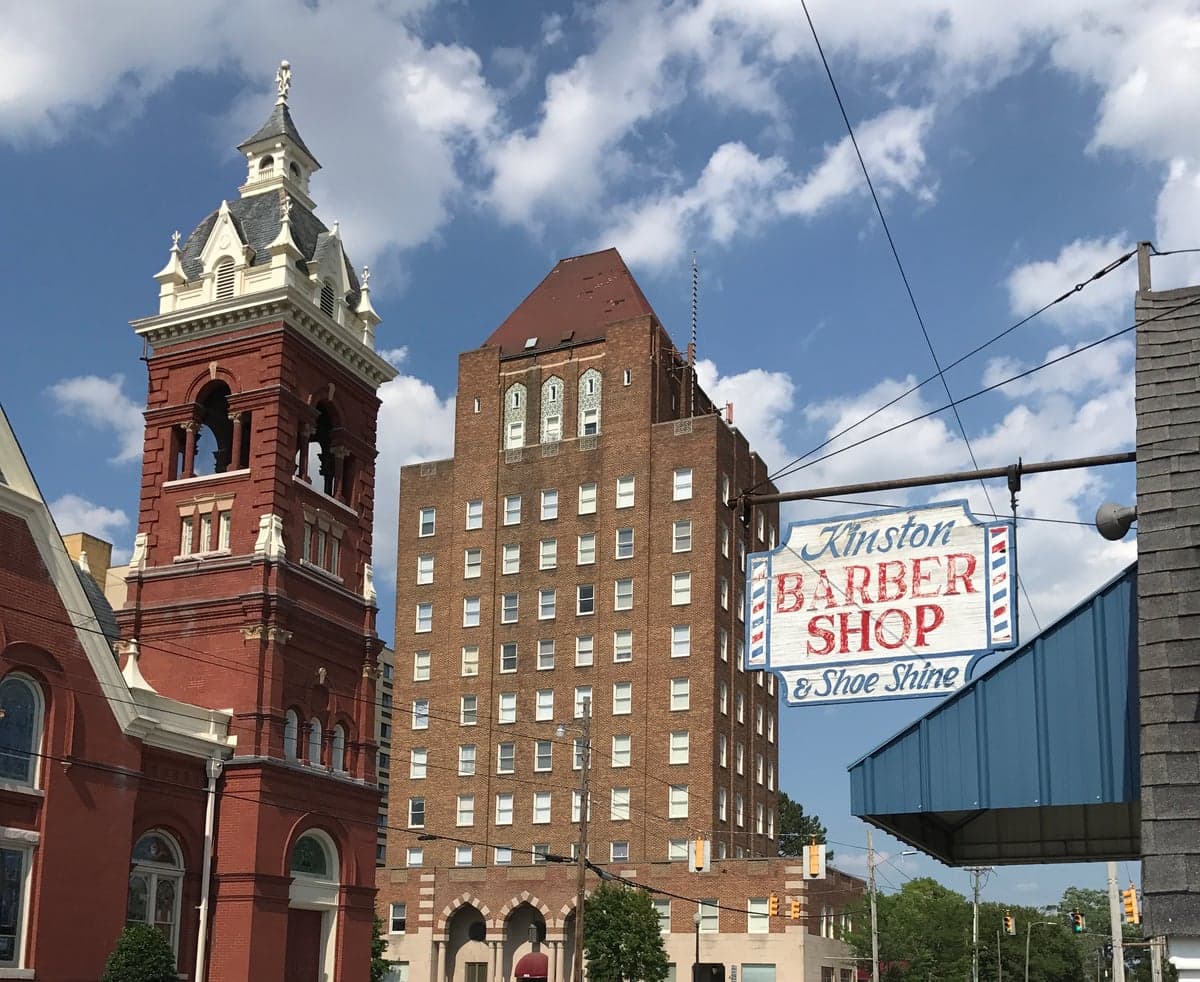
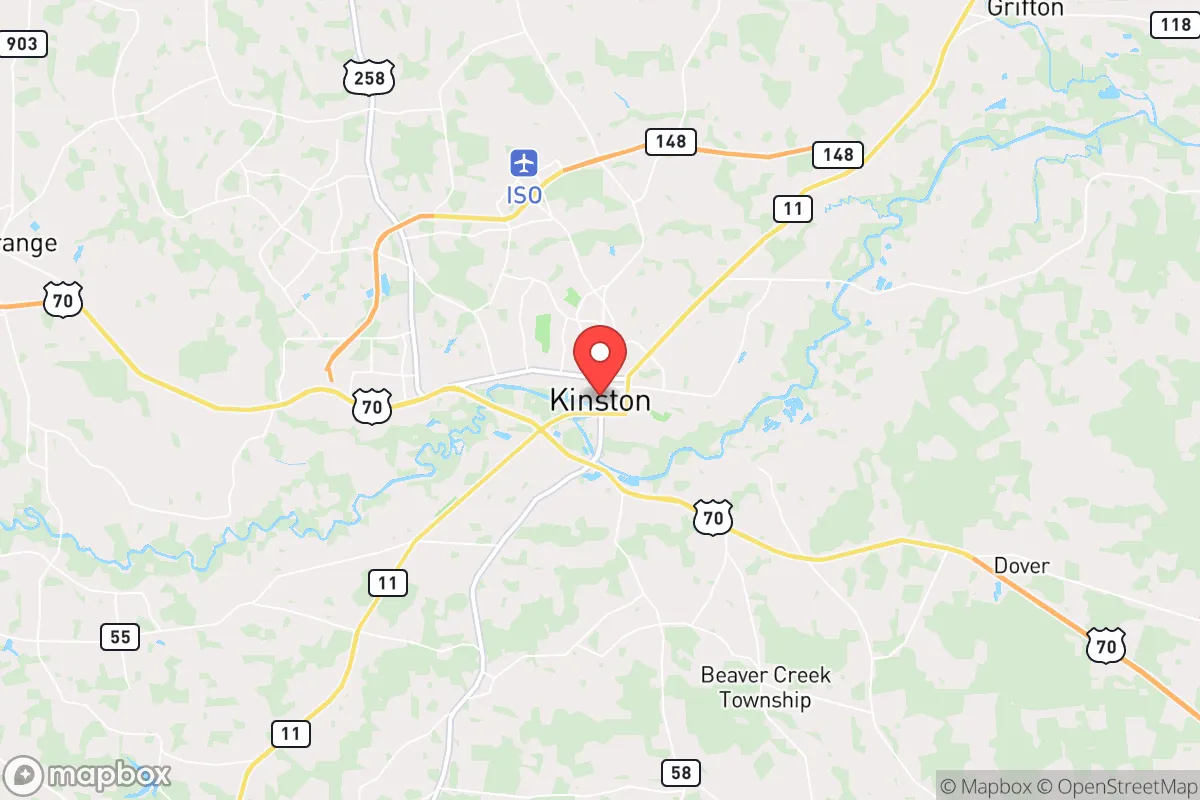
Photo: Wikipedia
Demographics of Kinston, NC
Affluence Level in Kinston, NC
A below-average socioeconomic profile. Incomes, home values, and educational attainment trail the U.S., with higher poverty and unemployment.
People of Kinston, NC
Kinston, North Carolina, is a city of 19,576 residents where the population is predominantly Black (65.8%) with a White population of 23.9%, reflecting deep roots in African American history and a smaller but established white community. The city’s foreign-born population is just 1.9%, and Hispanic residents make up 2.8%, while East/Southeast Asian communities account for 1.1% and Indian-subcontinent residents 0.5%. With only 16.1% of adults holding a college degree, Kinston’s identity is working-class and historically industrial, shaped by the tobacco and textile economies that once defined the region. The city’s population has declined steadily from its peak of over 25,000 in the 1970s, but a core of long-term families and a modest influx of retirees and remote workers are beginning to stabilize certain neighborhoods.
How the city was settled and grew
Kinston was founded in 1740 as a trading post on the Neuse River, originally called Kingston after King George II, though the name was shortened after the Revolutionary War. The early population was overwhelmingly English and Scots-Irish farmers who took up land grants in the surrounding Lenoir County, with the town serving as a river port for shipping naval stores and agricultural goods. By the mid-19th century, the arrival of the Atlantic and North Carolina Railroad in 1858 turned Kinston into a regional hub, drawing a small but growing free Black population alongside enslaved laborers who worked the cotton and tobacco fields. After the Civil War, newly freed African Americans established the Southgate and Lincoln City neighborhoods, which remain historically Black communities today, centered around churches, schools, and small businesses that anchored the post-Reconstruction era. The early 20th century brought a wave of white mill workers from rural eastern North Carolina to neighborhoods like Rivermont and Westwood, drawn by the DuPont textile plant (opened 1912) and the burgeoning tobacco industry led by companies like R.J. Reynolds. By 1950, Kinston’s population had reached 18,336, with a clear racial divide: white families concentrated in the newer subdivisions west of the railroad tracks, while Black families remained in the older eastern and southern wards.
Modern era (post-1965)
The post-1965 era brought dramatic demographic change as the Civil Rights movement dismantled legal segregation, but economic shifts accelerated population loss. The 1968 Fair Housing Act opened white neighborhoods to Black families, and by the 1980s, many middle-class Black households had moved into previously all-white areas like Woodland Terrace and Westwood, while white flight to surrounding unincorporated areas and the town of La Grange reduced Kinston’s white share from 45% in 1970 to under 25% today. The collapse of the textile and tobacco industries in the 1990s and 2000s—DuPont closed its plant in 2004, and the last tobacco warehouse shut down in 2010—triggered a net out-migration of working-age residents, particularly among younger Black families seeking jobs in Raleigh, Greenville, or out of state. The foreign-born population remains very low at 1.9%, with the largest group being Hispanic workers (2.8%) who arrived in the 2000s to fill labor gaps in agriculture and poultry processing, settling primarily in the North Kinston area near the Highway 11 corridor. East/Southeast Asian residents (1.1%) are mostly Vietnamese and Filipino families who came in the 1990s and 2000s, often as medical professionals at UNC Lenoir Health Care or as small business owners, with a small cluster of households in the Rivermont neighborhood. The Indian-subcontinent population (0.5%) is tiny but visible, concentrated among a handful of motel owners and convenience store operators who arrived in the 2010s.
The future
Kinston’s population is projected to continue a slow decline, falling to roughly 18,500 by 2035, but the rate of loss has slowed since 2020 as remote work and lower housing costs attract a small number of newcomers from the Raleigh-Durham area. The city is becoming slightly more diverse: the Hispanic share is expected to rise to 4-5% by 2035, driven by natural increase and continued agricultural labor demand, while the White share may stabilize around 22-24% as retirees and remote workers buy historic homes in Southgate and Lincoln City, which are seeing modest reinvestment. The Black population will remain the majority but is aging, with a median age of 41 compared to 35 for the city overall, meaning fewer young families unless local job creation improves. New residential development is concentrated in the Westwood area, where a 2024 subdivision added 40 single-family homes marketed to commuters working in Greenville (30 minutes north), but most of the city’s housing stock is older and affordable, with a median home value of $85,000. The cultural identity is shifting from a tobacco-and-textile town to a quieter, more residential community anchored by the CSS Neuse Civil War museum and the annual Kinston BBQ Festival, though the lack of college-educated residents (16.1%) limits the growth of a knowledge-economy workforce.
For someone moving in now, Kinston offers a deeply rooted, predominantly Black community with a strong sense of place, very low housing costs, and a slower pace of life, but limited economic opportunity and a shrinking population. The city is becoming a destination for retirees and remote workers seeking affordability rather than a magnet for young families or immigrants, meaning the demographic character will remain stable but older. Newcomers will find the most active neighborhoods in Westwood and Rivermont, where reinvestment is visible, while Southgate and Lincoln City retain the strongest historical identity and community institutions.

* Values derived from national, state, county, city and local statistics and may differ in a specific area. Last updated: 2026-11-08T22:29:04.000Z
Narrative content on this page is AI-generated and may contain mistakes. Verify any details that matter before acting on them.
ReloMaps may earn a commission from affiliate links at no extra cost to you.

