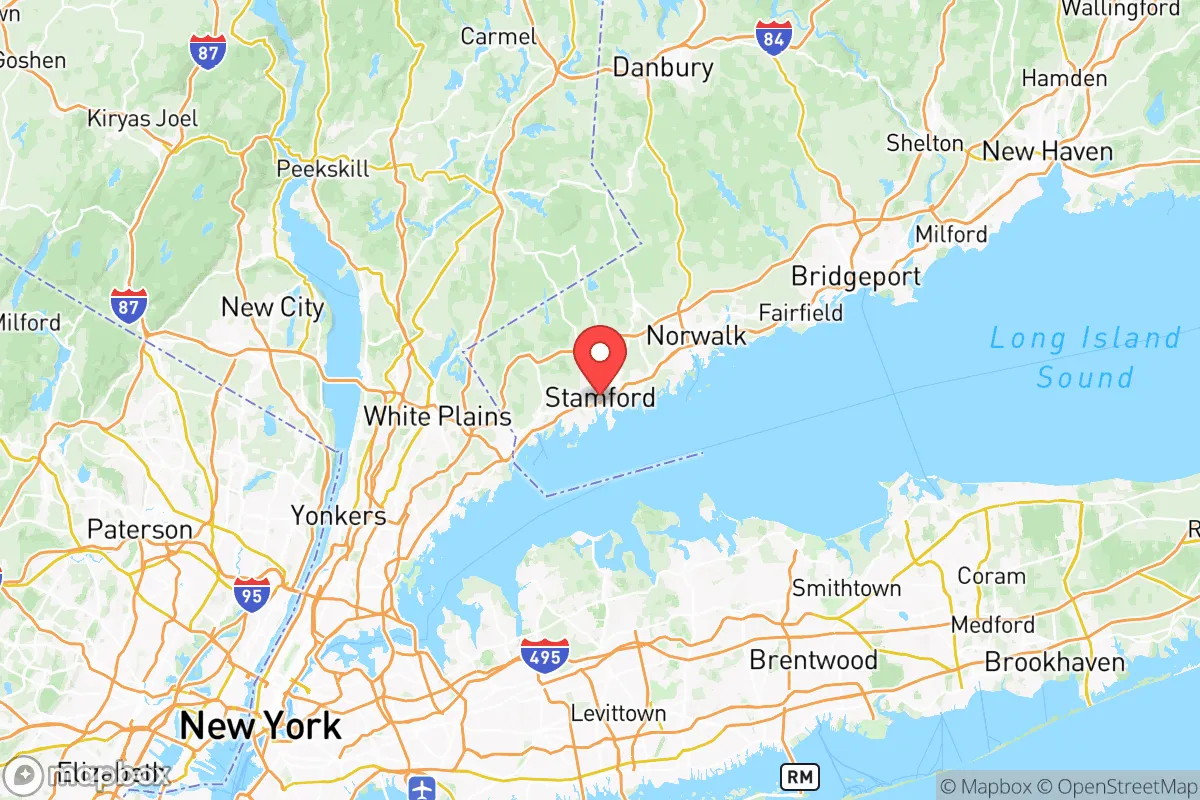
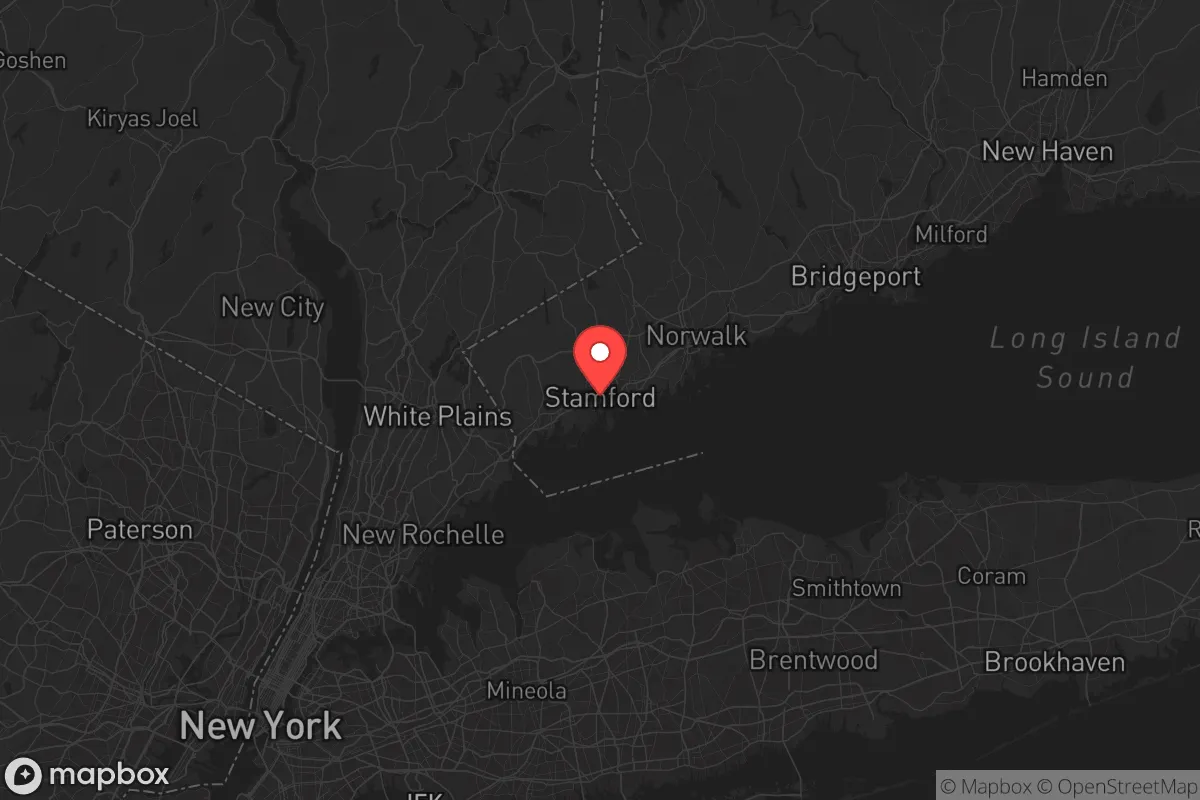
Demographics of Western Connecticut Planning Region County
Historical data isn't available for Western Connecticut Planning Region County. Trends shown are for Connecticut, Connecticut.
Affluence Level in Western Connecticut Planning Region County
An upper-middle-class area. Household wealth, education levels, and homeownership run ahead of national benchmarks.
People of Western Connecticut Planning Region County
The people of Western Connecticut Planning Region County are a predominantly white, highly educated, and increasingly diverse population of 621,232, concentrated in a corridor of affluent suburbs and historic industrial towns stretching from the New York border northward. The region is defined by its commuter-shed character—over 55% of adults hold a college degree—and a demographic profile that is 59.7% white, 19.9% Hispanic, 9.8% Black, 2.9% East/Southeast Asian, and 2.4% Indian, with 11.4% foreign-born. This is a place where old Yankee stock, later waves of European immigrants, and recent arrivals from Latin America, Asia, and India coexist in a landscape of dense village centers, protected watersheds, and corporate campuses.
Settlement & growth (pre-1960)
Before European colonization, the region was home to the Paugussett and Wappinger peoples, Algonquian-speaking tribes who lived in seasonal villages along the Housatonic and Naugatuck Rivers. English colonists from the Massachusetts Bay and Connecticut colonies began settling the area in the 1630s and 1640s, establishing the towns of Stratford (1639), Fairfield (1639), and Norwalk (1649) as agricultural outposts. These early settlers were primarily Puritan English families who parceled land into the classic New England pattern of village greens and outlying farms.
The 18th and early 19th centuries brought a second wave: Scots-Irish and German farmers who pushed inland into the Litchfield Hills, founding New Milford, Kent, and Sharon. These groups were drawn by affordable land and religious tolerance, establishing small-scale agriculture and iron-forging operations that fed the region's early industrial economy.
The industrial revolution transformed the region after 1840. The Naugatuck Valley became a powerhouse of brass, clock, and rubber manufacturing, pulling in massive waves of immigrants. Irish laborers arrived in the 1840s and 1850s, fleeing the Great Famine, to build railroads and work in factories in Danbury and Waterbury. Italian immigrants followed in the 1880s-1910s, settling in Bridgeport and Stamford to work in manufacturing and construction. Polish and Hungarian families came to the same mill towns, forming tight-knit ethnic neighborhoods around Catholic parishes. By 1920, nearly a third of the region's population was foreign-born, concentrated in the industrial cities along the coast and the Naugatuck Valley.
The post-World War II era saw a dramatic suburban shift. The 1950s and early 1960s brought a wave of white-collar domestic migrants—many from New York City and other parts of the Northeast—who were drawn by the expansion of corporate headquarters in Stamford and Greenwich, as well as the GI Bill and highway construction (I-95, the Merritt Parkway). These new residents were overwhelmingly white, college-educated, and seeking single-family homes in towns like Westport, Darien, and New Canaan, which grew rapidly as bedroom communities for Manhattan commuters.
Modern era (post-1965)
The 1965 Hart-Cellar Act fundamentally reshaped the region's demographics, though the effects were slower to appear here than in gateway cities like New York or Los Angeles. The first major post-1965 wave was Puerto Rican migration, which began in the 1960s and accelerated through the 1970s, as families moved from the island to industrial cities like Bridgeport and Danbury for manufacturing jobs. This was followed by Dominican and Guatemalan immigration in the 1980s and 1990s, again concentrated in Bridgeport and Danbury, where service-sector and light-manufacturing work was available. Today, the Hispanic population of 19.9% is the region's largest minority group, with the highest concentrations in Bridgeport (where Hispanics make up over 40% of the population) and Danbury (over 30%).
The Black population, at 9.8%, has deeper roots. The Great Migration brought African Americans from the South to Bridgeport and Stamford between 1940 and 1970, drawn by wartime manufacturing and later by service-sector jobs. A smaller but significant wave of Jamaican and Haitian immigrants arrived in the 1980s and 1990s, settling primarily in Bridgeport and Norwalk. The Black population today is concentrated in the region's urban centers, with Bridgeport being over 30% Black.
East/Southeast Asian communities (2.9%) began growing in the 1980s, with Chinese and Korean families settling in Stamford and Greenwich, drawn by professional opportunities in finance and technology. A smaller Vietnamese community formed in Danbury, anchored by a Buddhist temple and a cluster of restaurants and markets. The Indian population (2.4%) is a more recent phenomenon, growing rapidly since 2000 as tech and pharmaceutical companies expanded in Stamford and Danbury. Indian families are highly educated and dispersed across the region's affluent suburbs, with notable concentrations in Stamford and Ridgefield.
Domestic migration has also shifted. Since 2000, the region has seen a net outflow of lower-income residents to the South and Southwest, replaced by higher-income newcomers from New York City and other expensive metros. This "coastal flight" has accelerated since 2020, with remote work allowing families to trade Manhattan apartments for larger homes in towns like Bethel and Newtown. The result is a region that is becoming simultaneously more diverse and more economically stratified, with the urban cores growing more Hispanic and Black while the outer suburbs remain predominantly white and wealthy.
The future
The population of Western Connecticut Planning Region County is heading toward greater diversity, but at a slower pace than the nation as a whole. The white share (59.7%) is declining gradually, while the Hispanic and Asian shares are rising. The Indian population, in particular, is expected to grow as tech and biotech sectors expand in Stamford and Danbury, attracting skilled workers from the subcontinent. The East/Southeast Asian population will likely grow more modestly, concentrated in the same professional corridors.
The region's cultural identity is evolving from a historically Yankee and European-immigrant character to a more polyglot one, but the change is uneven. Bridgeport and Danbury are becoming majority-minority cities, while towns like Greenwich, New Canaan, and Ridgefield remain overwhelmingly white and affluent. The next 10-20 years will likely see continued suburban dispersal of immigrant groups, as second-generation Hispanic and Asian families move outward from urban cores into towns like Monroe and Brookfield. The region's political character, currently moderate to liberal in the coastal towns and more conservative inland, may shift slightly leftward as the electorate becomes more diverse.
For someone moving in now, Western Connecticut Planning Region County offers a choice of distinct communities: dense, diverse urban centers with lower costs; affluent, predominantly white commuter suburbs with top-ranked schools; or rural towns in the Litchfield Hills with a slower pace. The region is becoming more diverse and more expensive, but it remains one of the most educated and economically dynamic areas in the Northeast, with a population that values stability, nature, and proximity to New York City.

* Values derived from national, state, county, city and local statistics and may differ in a specific area. Last updated: 2026-06-17T00:30:19.000Z
Narrative content on this page is AI-generated and may contain mistakes. Verify any details that matter before acting on them.
ReloMaps may earn a commission from affiliate links at no extra cost to you.

