
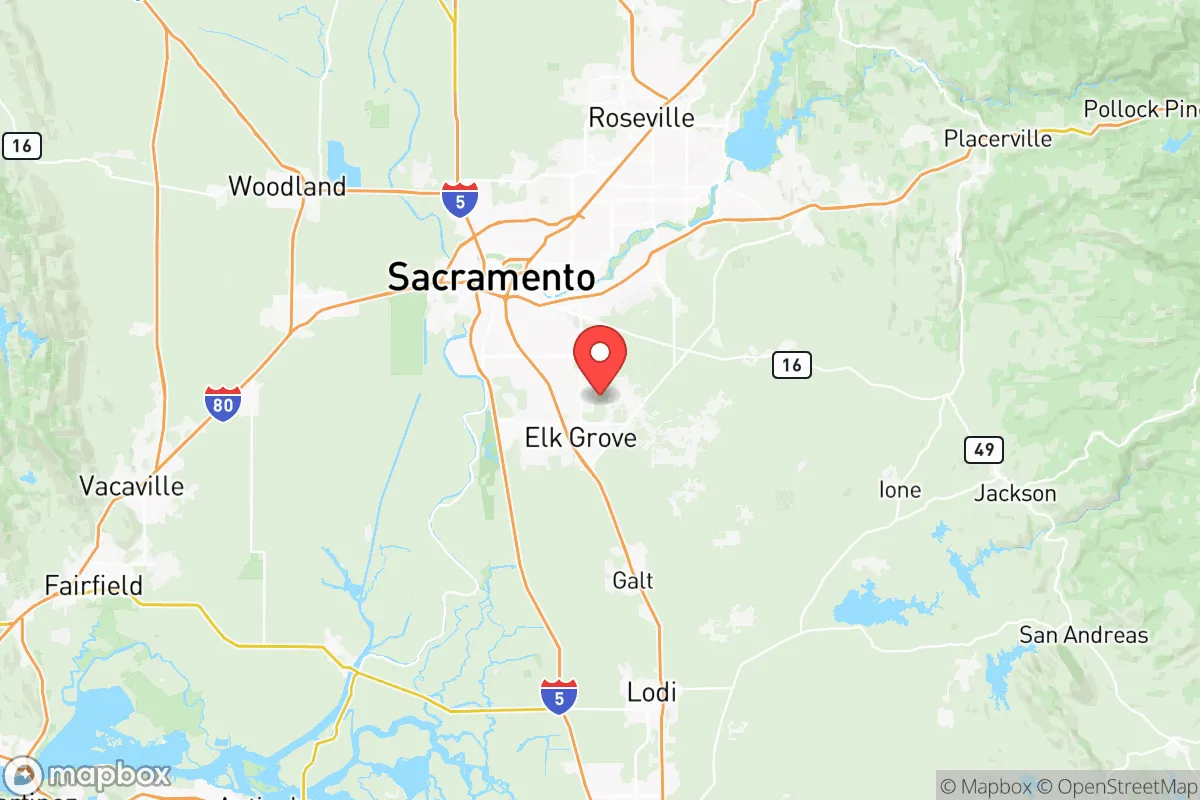
Photo: Wikipedia
Quality of Life in Sacramento County
A livable area that tracks near national norms for affordability, walkability, and neighborhood health.
What does Quality of Life tell us?
Quality of Life measures an area by evaluating factors like cost of living, nearby amenities, country club access, airport proximity, socioeconomic signals and neighborhood character. For large states, this is a general average — quality of life can vary dramatically between metro areas, suburbs, and rural communities within the same state.
What does this tell us?
Quality of Life measures an area by evaluating factors like cost of living, nearby amenities, country club access, airport proximity, socioeconomic signals and neighborhood character. For large states, this is a general average — quality of life can vary dramatically between metro areas, suburbs, and rural communities within the same state.
Cost of Living
59% above national average
62%
The Real Cost of Living in Sacramento County for 2026
| Tier | Individual | Family (4) |
|---|---|---|
| Survival | $27k | $51k |
| Comfortable | $97k | $142k |
| Luxury | $151k+ | $234k+ |
| Elite (Top 5%) | $177k+ | $275k+ |
Quality-of-Life Analysis
Sacramento County offers a broad spectrum of living environments, from the dense urban core of California’s capital city to quiet agricultural towns and rural foothill communities. The county appeals to a wide range of residents: state workers and urban professionals are drawn to the city centers of Sacramento and its suburbs, while those seeking a slower pace or more land gravitate toward smaller communities like Galt, Wilton, or the unincorporated areas of the Delta region. With a cost-of-living index of 159 (100 = U.S. average), the county is more affordable than the Bay Area but still significantly above the national norm, creating distinct trade-offs between proximity to jobs and housing value across its varied geography.
Largest town(s) & population centers
The city of Sacramento is the county’s anchor, home to roughly 525,000 residents and the seat of state government. Daily life here revolves around downtown’s Capitol Park, the Midtown dining and arts corridor, and the Sacramento River waterfront. The city offers a walkable core, light rail transit, and a mix of historic bungalows and new high-rise apartments. Adjacent suburbs such as Citrus Heights, Rancho Cordova, and Carmichael form a contiguous suburban belt with strip malls, mid-century tract homes, and commuter-oriented infrastructure. Elk Grove, the county’s second-largest city with over 175,000 residents, is a master-planned suburb known for its highly rated schools, family-oriented parks, and rapid population growth. These population centers share an average commute of roughly 28 minutes, though traffic on Interstates 5 and 80 can push that higher during peak hours. Median home values in these areas hover near the countywide figure of $498,900, with Elk Grove and parts of Sacramento proper commanding premiums, while older suburbs like Citrus Heights offer slightly lower entry points.
Smaller towns & rural pockets
East of the urbanized valley floor, the unincorporated community of Fair Oaks blends suburban development with rural character, featuring the American River Parkway and large-lot homes on tree-lined streets. Further south, Galt (population roughly 26,000) sits near the San Joaquin County line and retains an agricultural small-town feel, with a historic downtown and working farms on its outskirts. Wilton, an unincorporated area in the county’s southeast, is almost entirely rural, with horse properties, vineyards, and large parcels of land. In the Delta region, Walnut Grove, Courtland, and Isleton are tiny river communities (populations under 1,500) where levees, fishing, and farm-to-market roads define daily life. These areas offer a dramatically different pace from Sacramento’s urban core, but residents face longer commutes—often 35 to 50 minutes one-way—and limited access to grocery stores, healthcare, and public transit. Median rents in these rural pockets can fall below the countywide average of $1,702, though housing stock is older and more varied in condition.
Cost & lifestyle range
The cost-of-living spread across Sacramento County is wide. At the high end, Elk Grove and the Fabulous Forties neighborhood of East Sacramento feature median home values well above $600,000, with newer construction and top-tier schools driving demand. Mid-range areas like Rancho Cordova and Carmichael offer median prices closer to $450,000–$500,000, with a mix of fixer-uppers and updated homes. At the lower end, North Sacramento and parts of Del Paso Heights have median values under $350,000, though these neighborhoods face higher crime rates and fewer amenities. Rural areas like Wilton and Galt offer land and privacy at prices comparable to mid-range suburbs, but with trade-offs in commute time and service access. Renters see similar variation: a one-bedroom in Midtown Sacramento averages $1,800–$2,200, while comparable units in Galt or Walnut Grove may rent for $1,200–$1,500. The county’s overall median rent of $1,702 reflects this mix, but actual rents vary by as much as 40% between the most and least expensive neighborhoods.
Sacramento County works best for residents who value choice across a single county boundary. State employees and downtown professionals can live within walking distance of the Capitol, while families seeking good schools and newer homes gravitate to Elk Grove or the outer suburbs. Rural enthusiasts can find acreage and quiet in Wilton or the Delta towns, accepting longer commutes and fewer conveniences. The county’s diversity of settings—from urban lofts to farmhouses—means that most lifestyles are represented, though the cost-of-living index of 159 means that even the cheaper areas are not inexpensive by national standards. Those who thrive here are typically willing to trade either commute time or housing square footage for the specific environment they prefer, rather than expecting one area to deliver everything.

Crime in Sacramento County
WARNING: The crime statistics are unreliable for this jurisdiction. Local authorities have either not reported or under reported their data to the FBI. This could be due to bad intentions, incompetence or technical issues. Regardless, we suggest skepticism.
Higher crime rates than 72% of comparable U.S. locations.
Violent CrimeViolent Crime Analysis
Property CrimeProperty Crime Analysis
Crime Analysis
Sacramento County’s overall safety picture is mixed, with crime rates that exceed both state and national averages, particularly in property crime. The county recorded a violent crime rate of 434.4 per 100,000 residents and a property crime rate of 1,818.4 per 100,000 in the most recent reporting period. While these figures place the county above California’s average, they mask significant variation between the urban core of Sacramento and its suburban and rural communities, where residents experience markedly different levels of risk.
Crime in context
Sacramento County’s violent crime rate of 434.4 per 100,000 is roughly 20% higher than the California state average and about 25% above the national median. Property crime, at 1,818.4 per 100,000, is similarly elevated — approximately 30% above the state figure and nearly double the national rate for comparable suburban counties. These numbers are driven largely by the city of Sacramento itself, which accounts for the majority of reported incidents. By contrast, smaller cities within the county such as Elk Grove, Folsom, and Rancho Cordova report significantly lower violent crime rates, often falling below 300 per 100,000. The county’s progressive District Attorney, Thien Ho, has pursued a reform-oriented approach that emphasizes diversion programs and reduced sentencing for certain non-violent offenses, a policy stance that critics argue has contributed to a perception of leniency and higher recidivism in the urban core.
What residents experience
For residents, the most tangible safety concern is property crime. Vehicle theft, burglary, and package theft are common complaints across the county, with Sacramento’s downtown and midtown neighborhoods seeing the highest concentrations. In 2024, the city of Sacramento reported over 8,000 vehicle thefts alone — a rate that places it among the worst in California for that category. Residents in Citrus Heights and North Highlands also report elevated property crime, while Folsom and El Dorado Hills (the latter technically in El Dorado County but part of the metro area) experience rates closer to the national average. Violent crime, while less frequent, is concentrated in specific corridors: the Del Paso Heights, Oak Park, and South Sacramento neighborhoods see the bulk of aggravated assaults and robberies. Many residents adjust their daily routines accordingly — avoiding certain streets after dark, using steering-wheel locks, and relying on neighborhood watch groups that are active in suburban subdivisions.
Neighborhood-level variation
Safety in Sacramento County is highly neighborhood-dependent. The urban core of Sacramento, particularly areas near the State Capitol and along the Interstate 80 and Highway 99 corridors, has the highest crime density. In contrast, Elk Grove — the county’s second-largest city — consistently ranks as one of the safest large suburbs in the region, with a violent crime rate near 250 per 100,000 and a strong community policing presence. Folsom benefits from its affluent tax base and well-funded police department, reporting property crime rates roughly half the county average. Rancho Cordova, once a high-crime area, has seen gradual improvement through targeted policing and redevelopment, though it still lags behind Elk Grove and Folsom. For prospective residents, choosing a specific city or neighborhood within the county is the single most important factor in determining personal safety — the difference between a violent crime rate of 200 and 600 per 100,000 can be a matter of a 15-minute drive.
* Values derived from national, state, county, city and local statistics and may differ in a specific area. Last updated: 2026-06-24T23:08:21.000Z
Narrative content on this page is AI-generated and may contain mistakes. Verify any details that matter before acting on them.
ReloMaps may earn a commission from affiliate links at no extra cost to you.

