Photo: Wikipedia
Quality of Life in Burlington, VT
A high quality of life with strong walkability, manageable living costs, healthy neighborhood signals, and solid amenity access.
What does Quality of Life tell us?
Quality of Life blends cost of living, nearby amenities, socioeconomic signals, and neighborhood character. City-level scores represent the whole municipality; individual neighborhoods can differ.
What does this tell us?
Quality of Life blends cost of living, nearby amenities, socioeconomic signals, and neighborhood character. City-level scores represent the whole municipality; individual neighborhoods can differ.
Cost of Living
40% above national average
The Real Cost of Living in Burlington, VT for 2026
| Tier | Individual | Family (4) |
|---|---|---|
| Survival | $26k | $48k |
| Comfortable | $78k | $114k |
| Luxury | $124k+ | $193k+ |
| Elite (Top 5%) | $162k+ | $252k+ |
60%
The Area Signal
A metric tracking the socioeconomic signals of the area.
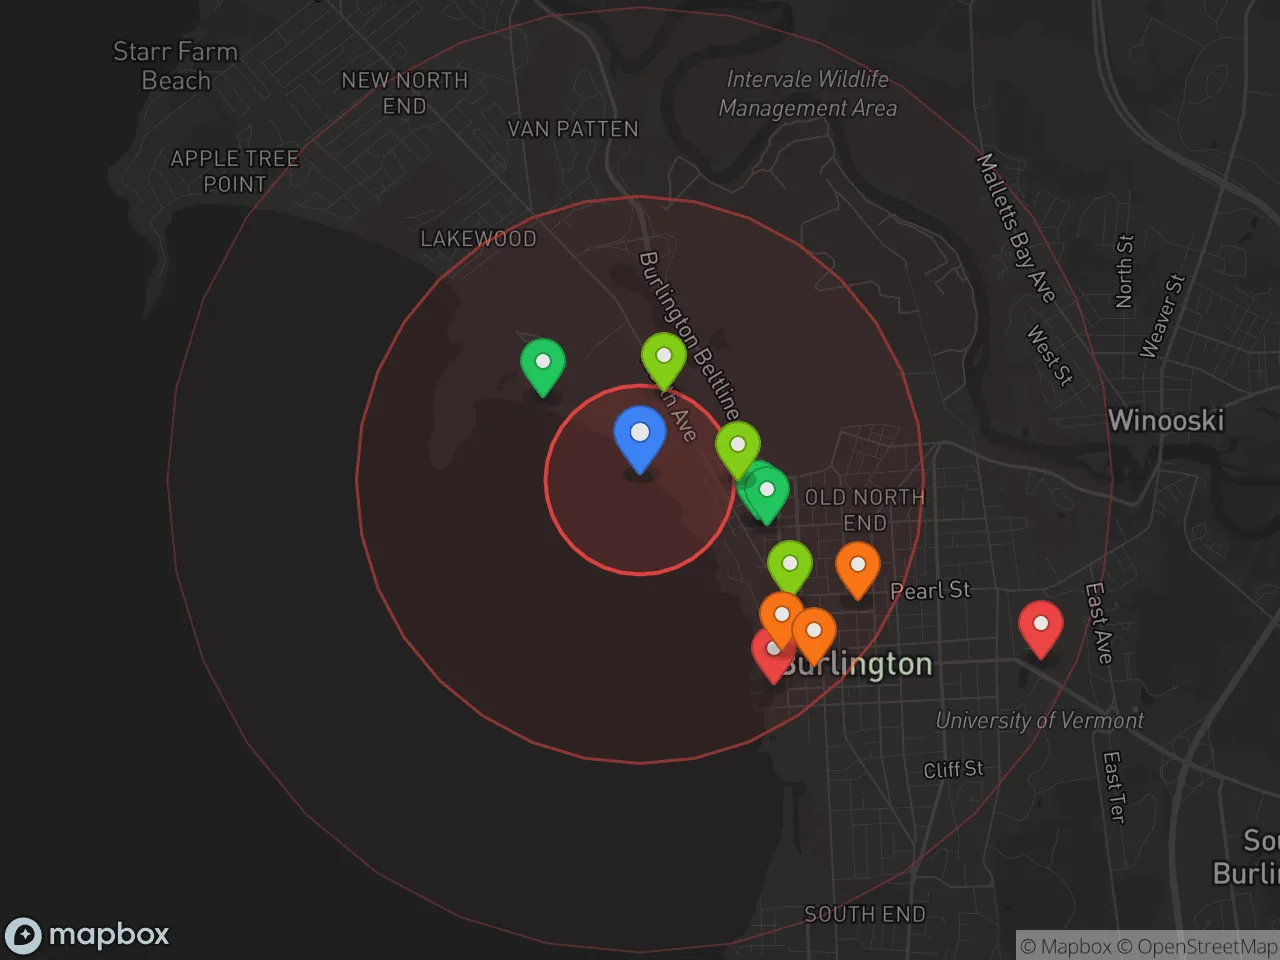
Hobbies
Explore the areaGroceries
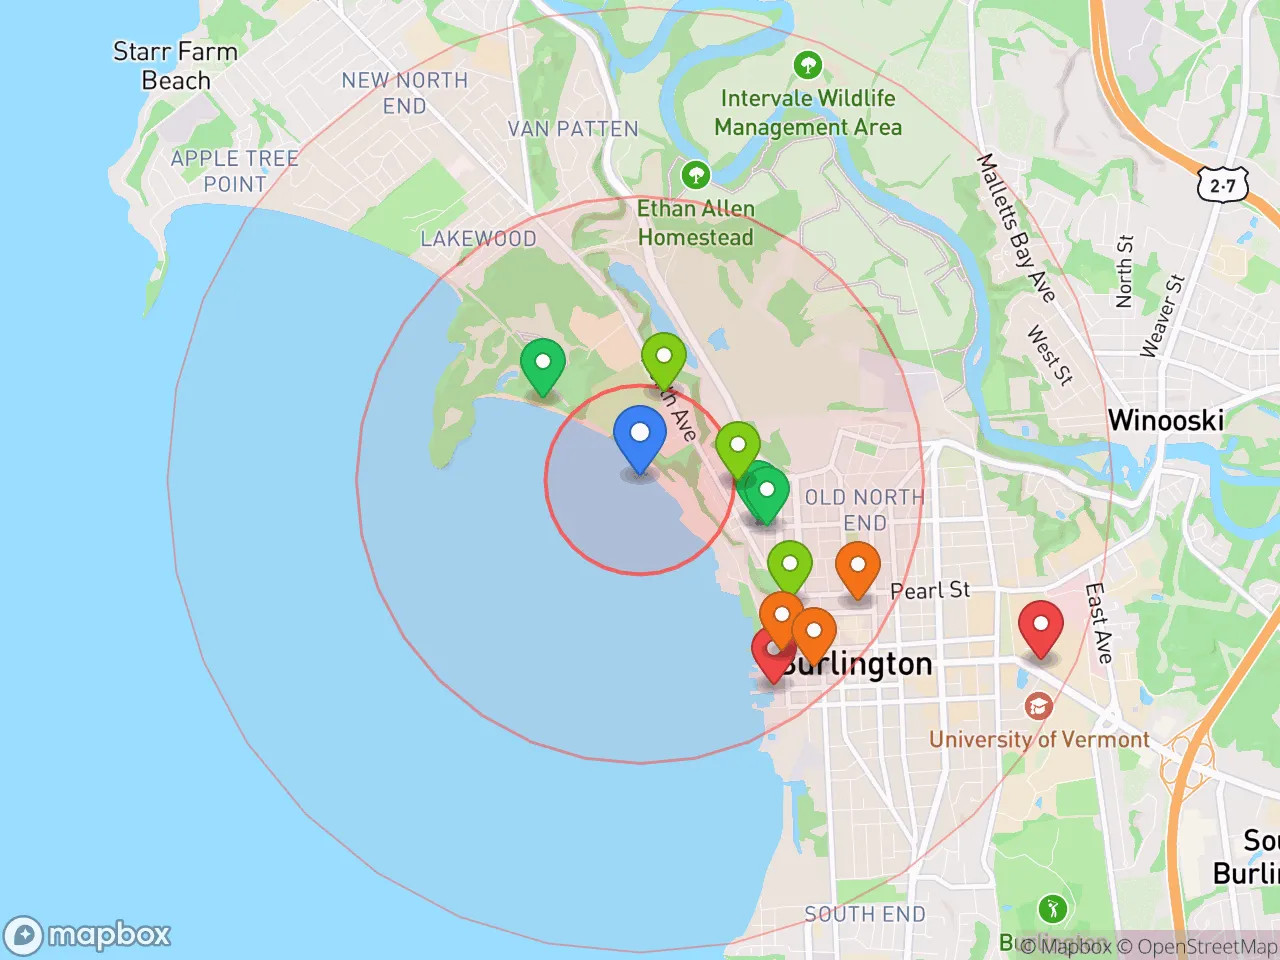
6 within 10 miles
Gas
20 within 10 miles
Hospital
2 within 20 miles
Airport
PDX — Portland International Jetport
Post Office
USPS — Burlington, VT
Critical Amenities
Quality-of-Life Analysis
Burlington, Vermont, is a compact, affluent city where the quality of life is shaped by a blend of progressive politics, a strong outdoor culture, and a high cost of entry. With a cost of living index of 140 (40% above the U.S. average), the city attracts a demographic mix of University of Vermont students and faculty, remote tech workers, and families drawn to its walkable downtown and Lake Champlain shoreline. The population skews younger and more educated than the state average, creating a lively, civic-minded community that prizes local food, environmental sustainability, and year-round recreation.
Cost of living, housing affordability, and how Burlington compares to nearby towns
Burlington’s housing market is the primary driver of its elevated cost of living. The median home value sits at $400,200, while the median rent is $1,609 per month—both well above national medians and significantly higher than in neighboring communities like Winooski or South Burlington. For context, Winooski’s median home value is roughly $340,000, and South Burlington’s is around $380,000, making Burlington the most expensive housing market in Chittenden County. Renters face particular pressure, as vacancy rates have hovered below 2% in recent years, pushing competition for apartments. The average commute in Burlington is just 19.2 minutes, one of the shortest in New England, which offsets some housing costs by reducing transportation expenses and allowing residents to live car-light or car-free. However, for households earning the area’s median income of roughly $60,000, homeownership remains out of reach without significant savings or dual incomes.
What daily life is like: amenities, schools, and the rhythm of the city
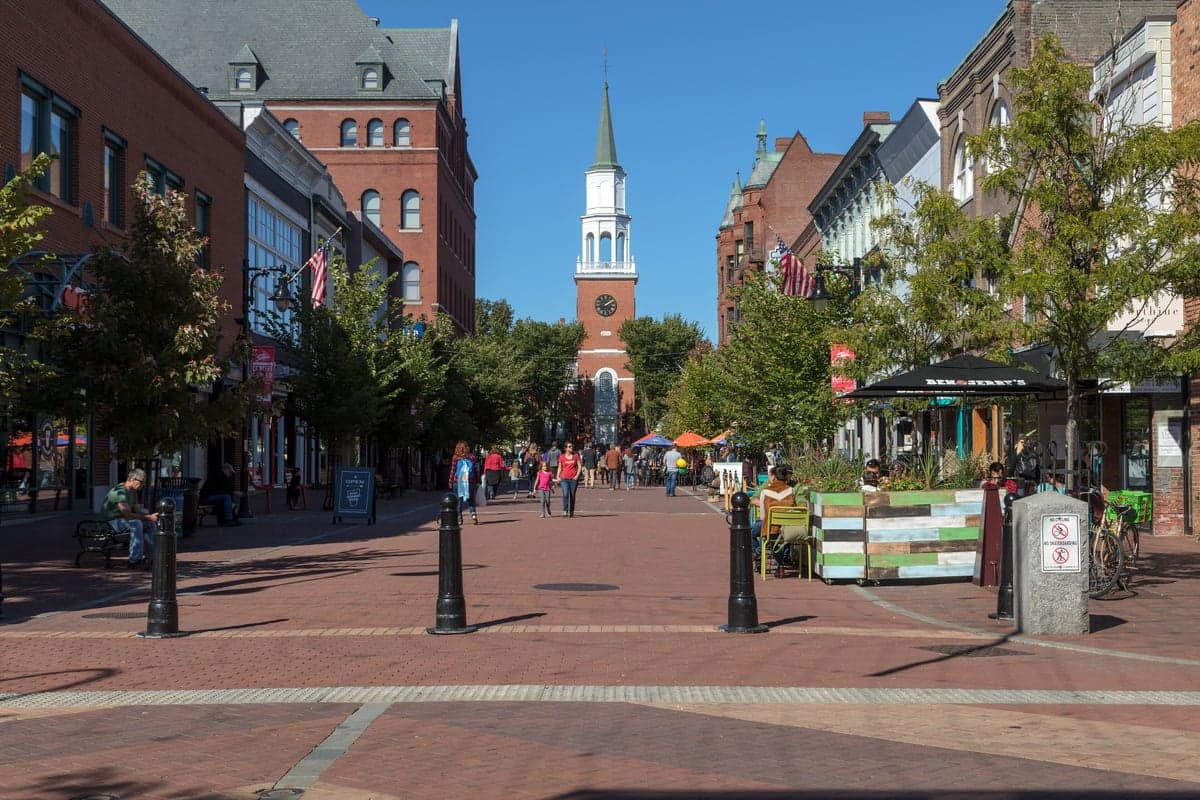
Daily life in Burlington revolves around a walkable downtown core, the Church Street Marketplace pedestrian mall, and easy access to Lake Champlain’s waterfront parks. The Burlington School District includes Burlington High School (rebuilt after a PCB contamination closure in 2020) and several magnet-style elementary schools, though some families opt for South Burlington or Shelburne schools for higher test scores. The city’s rhythm is shaped by the academic calendar of the University of Vermont and Champlain College, which bring a youthful energy and a robust calendar of farmers’ markets, concerts, and festivals. Outdoor amenities are exceptional: residents can bike the Island Line Trail, ski at Bolton Valley (30 minutes away), or kayak on the lake within minutes of leaving home. Healthcare is anchored by the University of Vermont Medical Center, the state’s largest hospital and a major employer. The trade-off is limited retail diversity—big-box shopping is minimal—and a restaurant scene that, while strong for a city of 45,000, can feel repetitive to long-term residents.
Burlington is best suited for people who value walkability, outdoor recreation, and community engagement over low housing costs or sprawling suburban amenities. Young professionals, remote workers with flexible incomes, and families who can afford the premium for a lakefront lifestyle will find the city’s short commutes and tight-knit neighborhoods rewarding. Those seeking affordable homeownership or a mild climate may struggle, but for the right demographic, Burlington offers a quality of life that few small cities can match.

Crime in Burlington, VT
Higher crime rates than 57% of comparable U.S. locations.
Violent CrimeViolent Crime Analysis
Property CrimeProperty Crime Analysis
Crime Analysis
Burlington, Vermont, presents a complex safety picture that diverges sharply from its reputation as a peaceful college town. The city's violent crime rate stands at 482.5 incidents per 100,000 residents, while property crime reaches 4,092.1 per 100,000—both figures significantly exceeding national averages. These elevated rates are a growing concern for prospective residents, particularly given the city's progressive judicial environment, which critics argue prioritizes offender rehabilitation over public safety and victim accountability.
Crime in context
Burlington's crime rates far outpace both Vermont state averages and national benchmarks. The violent crime rate of 482.5 per 100,000 is roughly 1.3 times the national average and dramatically higher than Vermont's statewide rate of approximately 200 per 100,000. Property crime is even more pronounced: at 4,092.1 per 100,000, it is nearly double the national average and roughly triple the Vermont state average. These disparities are especially stark given that Burlington is a small city of roughly 45,000 residents. The city's progressive district attorney and judges, who have championed bail reform, diversion programs, and reduced sentencing for nonviolent offenses, are frequently cited by local law enforcement as contributing to a cycle of repeat offending and diminished deterrence.
What residents experience
For those living in Burlington, property crime is the most tangible safety issue. Vehicle break-ins, bicycle thefts, and package thefts are commonplace, particularly in densely populated neighborhoods near the University of Vermont and downtown. Violent crime, while less frequent, includes aggravated assaults and robberies that often occur in the downtown core and along the Church Street Marketplace. Residents report a heightened sense of vulnerability after dark, especially in areas with high foot traffic and limited police presence. The city's approach to homelessness and drug addiction—focused on harm reduction rather than enforcement—has led to visible public disorder, including open drug use and aggressive panhandling, which further erodes the sense of safety for families and commuters.
Neighborhood-level variation
Safety in Burlington is not uniform. The Old North End, a densely populated, lower-income area, experiences the highest concentration of property crime and drug-related incidents. The South End, home to the city's arts district and more affluent residents, sees lower violent crime rates but still struggles with car break-ins and theft. The Hill Section near UVM is a mixed bag: daytime foot traffic and campus security provide some protection, but off-campus student housing is a frequent target for burglaries. Suburban neighborhoods like New North End and South Burlington (a separate municipality) offer significantly lower crime rates, making them attractive alternatives for families and professionals seeking a safer environment within commuting distance of downtown.
* Values derived from national, state, county, city and local statistics and may differ in a specific area. Last updated: 2026-06-13T22:02:58.000Z
Narrative content on this page is AI-generated and may contain mistakes. Verify any details that matter before acting on them.
ReloMaps may earn a commission from affiliate links at no extra cost to you.

