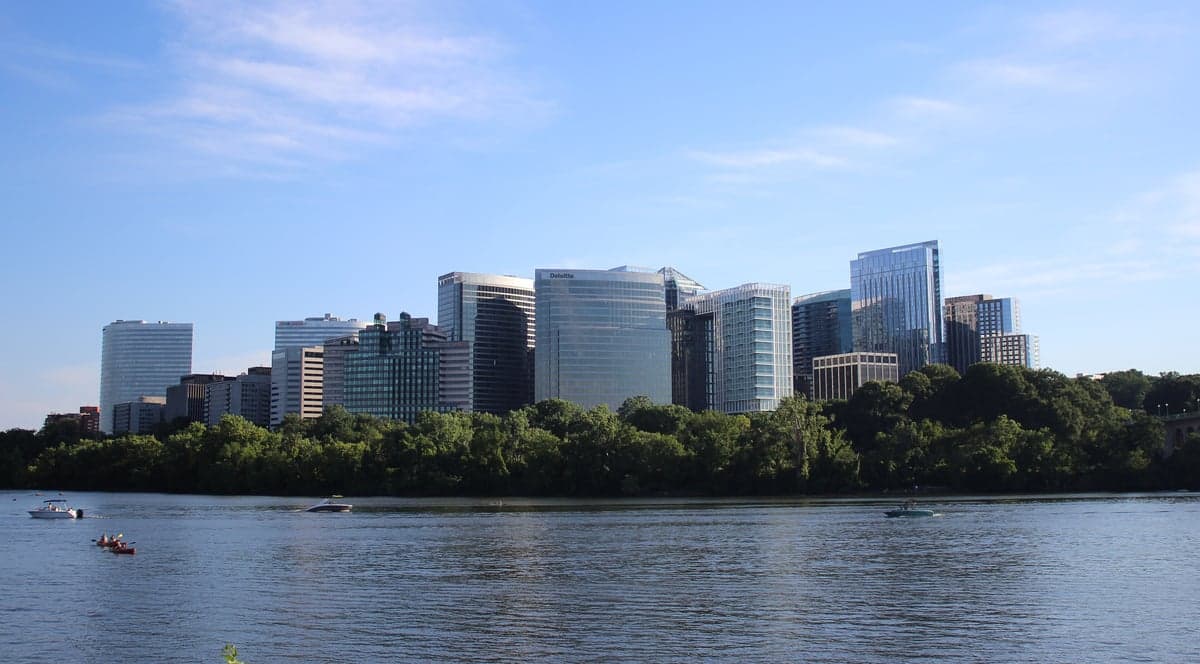
Photo: Wikipedia
Demographics of Arlington, VA
Affluence Level in Arlington, VA
An upper-middle-class area. Household wealth, education levels, and homeownership run ahead of national benchmarks.
People of Arlington, VA
Arlington, Virginia is a densely populated urban county of 235,463 residents defined by its high educational attainment—77.1% hold a college degree—and its deep integration with the federal government. The population is predominantly White (58.8%), with a significant Hispanic community (15.7%), a Black population of 9.2%, and growing East/Southeast Asian (6.8%) and Indian subcontinent (3.6%) communities. Foreign-born residents make up 10.6% of the population, a relatively modest share for a major Washington, D.C. suburb, reflecting Arlington’s historic character as a domestic magnet for government and professional workers rather than a primary immigrant gateway.
How the city was settled and grew
Arlington’s original population was shaped by its position as a rural farming district across the Potomac from the nation’s capital. The land was part of a 6,000-acre tract granted to the Custis family in the 17th century, and the area remained sparsely populated through the 1800s, with enslaved African Americans working the plantations. The Civil War transformed the region: the federal government seized the Arlington estate (now Arlington National Cemetery) and built forts across the county, drawing Union soldiers and freedmen. After the war, the village of Freedman’s Village near present-day Pentagon City housed formerly enslaved people, laying the foundation for a Black community that later concentrated in Green Valley (now often called Nauck). The 20th century brought explosive growth as the federal bureaucracy expanded. The 1902 opening of the Rosslyn streetcar line and the 1932 completion of the Memorial Bridge made Arlington a commuter suburb for Washington. The Pentagon’s 1943 construction drew thousands of defense workers, and by 1950 the population had surged past 135,000. These mid-century arrivals were overwhelmingly White, middle-class, and native-born, settling in neighborhoods like Clarendon and Ballston along the new commercial corridors.
Modern era (post-1965)
The 1965 Hart-Cellar Act and the 1970s Metro system reshaped Arlington’s population. The Orange and Blue Line stations, completed between 1977 and 1986, turned Courthouse, Clarendon, and Ballston into high-density transit-oriented hubs, attracting young professionals and empty-nesters. The county’s 1970s “urban village” plan deliberately concentrated development around Metro stops while preserving single-family neighborhoods, creating a distinct demographic pattern: dense, diverse corridors ringed by affluent, largely White residential areas. Hispanic migration accelerated in the 1980s and 1990s, driven by Central American refugees and later by economic migrants. The Columbia Pike corridor became the heart of Arlington’s Hispanic community, with a mix of Salvadoran, Guatemalan, and Mexican families. Today, 15.7% of Arlington’s population is Hispanic, and the Pike remains the county’s most ethnically diverse and affordable strip. The East/Southeast Asian population (6.8%) is more dispersed but has notable clusters near Lyon Village and Virginia Square, while the Indian subcontinent community (3.6%) has grown steadily since the 1990s tech boom, drawn by jobs in defense, consulting, and IT. The Black population, once concentrated in Green Valley and Arlington View, has declined from roughly 20% in 1980 to 9.2% today, as rising property values and gentrification have pushed many families to Prince George’s County and other more affordable suburbs.
The future
Arlington’s population is projected to grow modestly, reaching roughly 260,000 by 2040, driven by continued infill development along the Metro corridors and Amazon’s HQ2 in nearby Crystal City. The county is becoming slightly more diverse: the White share has declined from 65% in 2010 to 58.8% today, while the Hispanic and Asian shares have risen. The Indian subcontinent population is the fastest-growing major group, nearly doubling since 2010, and is dispersing across the county rather than concentrating in a single enclave. The East/Southeast Asian population is also growing but at a slower pace. The foreign-born share, at 10.6%, remains below the national average and is unlikely to spike, as Arlington’s high housing costs—median home prices exceed $700,000—filter for affluent, English-proficient migrants. The most significant demographic shift is generational: the county is aging, with a median age of 34, but the 25–34 cohort remains the largest, sustaining the area’s reputation as a magnet for early-career professionals. Gentrification pressures will likely continue to push lower-income and minority families outward, particularly from Columbia Pike and Green Valley, as redevelopment replaces older garden apartments with luxury mid-rises.
Arlington is becoming a more expensive, more educated, and moderately more diverse place—but its core identity as a government-and-tech professional hub is not changing. For someone moving in now, the county offers exceptional schools, transit access, and job proximity, but at a price that increasingly selects for dual-income, college-educated households. The historic working-class and Black communities that built the county are shrinking, while the Hispanic and Asian populations are growing but remain economically stratified. Arlington’s future is one of managed density and demographic stability, not transformation.

* Values derived from national, state, county, city and local statistics and may differ in a specific area. Last updated: 2026-10-01T19:42:59.000Z
Narrative content on this page is AI-generated and may contain mistakes. Verify any details that matter before acting on them.
ReloMaps may earn a commission from affiliate links at no extra cost to you.

