Photo: Wikipedia
Demographics of Woodstock, IL
Affluence Level in Woodstock, IL
A middle-class area roughly in line with national averages across income, home values, education, and employment.
People of Woodstock, IL
The people of Woodstock, Illinois, today number 26,316, forming a community that is predominantly White (70.6%) with a substantial and growing Hispanic population (22.2%), a small Black community (2.2%), and emerging East/Southeast Asian (1.9%) and Indian (0.5%) populations. The city’s character is defined by its historic square, a strong sense of local identity, and a demographic profile that is notably more diverse than surrounding McHenry County. With a foreign-born population of 7.4% and a college-educated rate of 31.4%, Woodstock’s residents blend long-standing family roots with newer arrivals drawn by its affordability and small-town atmosphere.
How the city was settled and grew
Woodstock’s human history begins with its founding in 1844 as the seat of McHenry County, a position it secured through a land donation from early settler Joel Johnson. The original population was almost entirely of Yankee and German Protestant stock, drawn by the promise of fertile farmland and the economic anchor of the county courthouse. The arrival of the Chicago and North Western Railway in the 1850s transformed the village into a regional trade hub, attracting a wave of Irish laborers who built the rail lines and settled in the Irish Addition, a neighborhood south of the tracks near what is now Calhoun Street. By the late 19th century, Swedish and Danish immigrants arrived to work in the growing dairy and farm-equipment industries, establishing a small enclave in the West Side around Dean Street. The city’s population remained overwhelmingly White and native-born through the mid-20th century, with the 1960 census recording a 99.6% White population.
Modern era (post-1965)
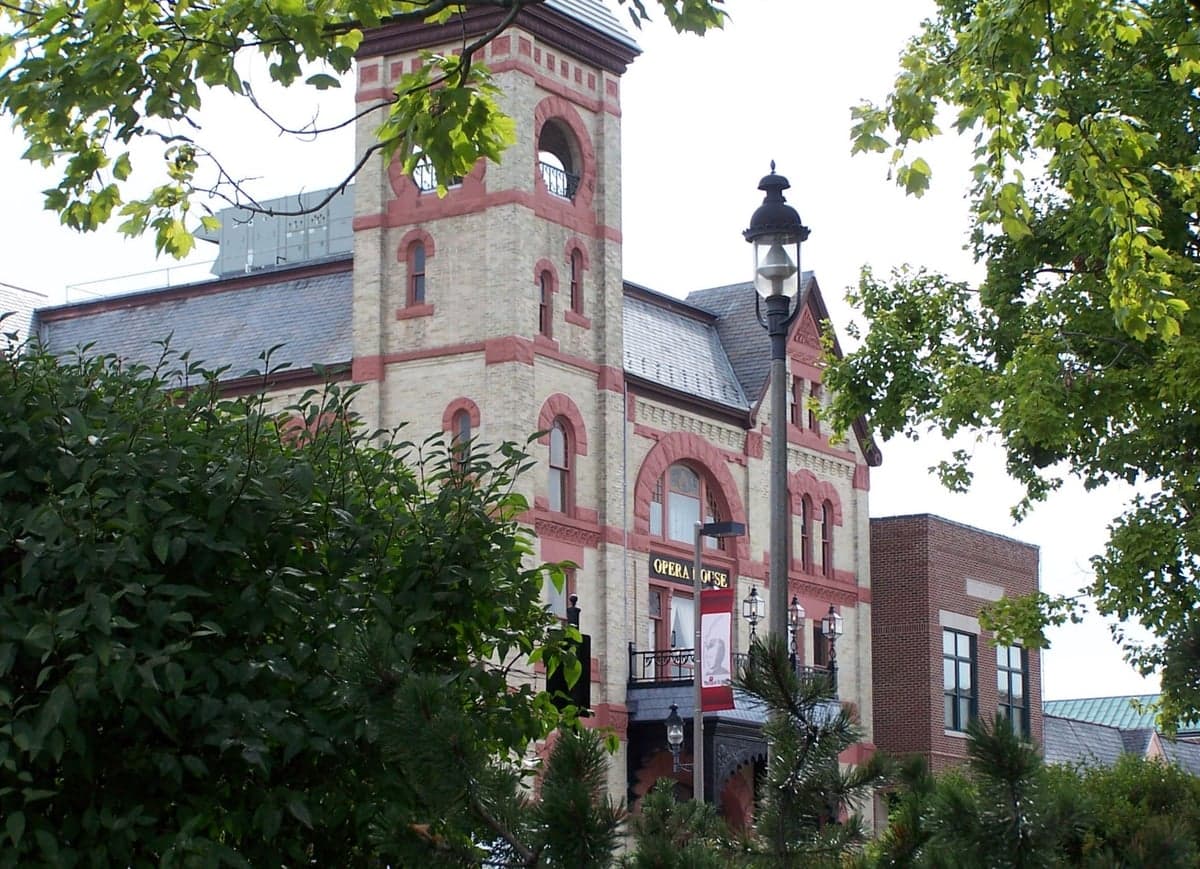
The post-1965 era brought the first significant demographic shifts. The Immigration and Nationality Act of 1965 opened the door for new arrivals, but Woodstock’s distance from Chicago meant that change came slowly. The most transformative wave began in the 1990s, as Hispanic families—primarily of Mexican origin—moved into the area for work in construction, manufacturing, and agriculture. This community concentrated in the South Side neighborhoods around Washington Street and in the Lakewood subdivision, where affordable housing stock and proximity to jobs at the Woodstock Die Casting plant and the now-closed Motorola facility provided a foothold. By 2010, the Hispanic share had risen to 17.4%, and by 2024 it reached 22.2%. The Black population, while small at 2.2%, has a longer history, with families settling in the Historic East Side near the old Woodstock Opera House and the Clay Street corridor, where a modest but stable community has persisted since the 1970s. East/Southeast Asian residents (1.9%) and Indian residents (0.5%) are more recent arrivals, often professionals drawn by the city’s schools and the proximity to employers in Crystal Lake and Elgin, and they tend to be dispersed rather than concentrated in a single neighborhood.
The future
Woodstock’s population is projected to continue its gradual diversification, though the pace is likely to be moderate. The Hispanic share is expected to rise toward 28-30% by 2040, driven by both natural increase and continued in-migration from the Chicago metro area. The White non-Hispanic share will continue its slow decline, but Woodstock is not experiencing the rapid ethnic turnover seen in some inner-ring suburbs. New residential developments on the northwest edge, near the Woodstock North High School and the Route 47 corridor, are attracting a mix of young families and empty-nesters, many of them White and middle-class, which will temper the pace of demographic change. The East/Southeast Asian and Indian populations are likely to grow slowly, as the area lacks the ethnic infrastructure—specialty grocery stores, religious institutions, professional networks—that draws larger concentrations to suburbs like Schaumburg or Naperville. The city’s cultural identity is evolving from a quietly homogeneous small town into a more layered community, with the annual Fiesta en la Plaza celebration on the square and the growing visibility of Hispanic-owned businesses along Route 47 reflecting this shift.
For someone moving to Woodstock now, the city offers a stable, family-oriented environment where the old and new are still negotiating their place. The schools are solid, the downtown is vibrant, and the cost of living remains below the Chicago suburban average. The demographic trends point toward a more diverse but still predominantly White community, where the Hispanic population will continue to grow as a visible and integrated part of the fabric, while other groups remain smaller and more dispersed. It is a place where a newcomer can find both a historic square and a changing face—a balance that defines Woodstock’s character today.

* Values derived from national, state, county, city and local statistics and may differ in a specific area. Last updated: 2026-09-03T21:01:44.000Z
Narrative content on this page is AI-generated and may contain mistakes. Verify any details that matter before acting on them.
ReloMaps may earn a commission from affiliate links at no extra cost to you.

