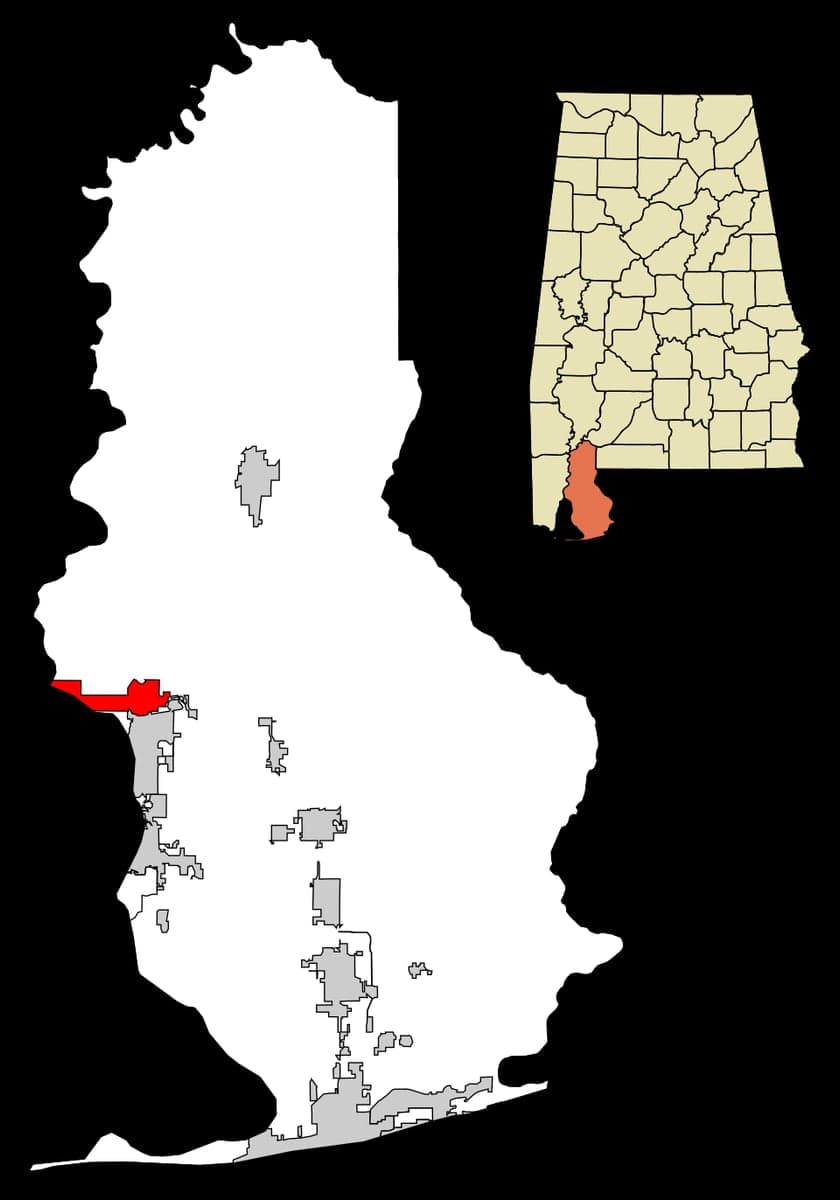
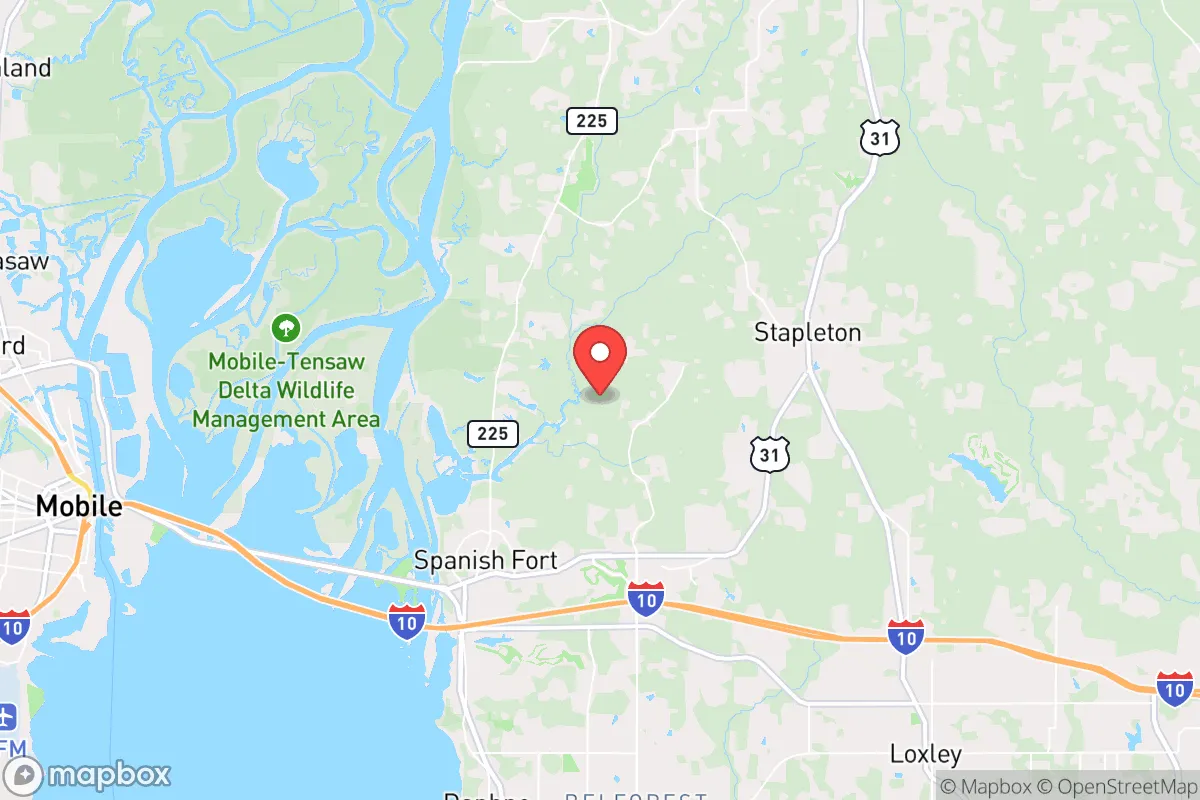
Photo: Wikipedia
Demographics of Spanish Fort, AL
Affluence Level in Spanish Fort, AL
An upper-middle-class area. Household wealth, education levels, and homeownership run ahead of national benchmarks.
People of Spanish Fort, AL
The people of Spanish Fort, Alabama, today number 10,377 and form a predominantly white, college-educated, and family-oriented community with a notably low foreign-born share of 6.0%. The city’s identity is shaped by its rapid suburban growth since the 1990s, attracting professionals and retirees seeking waterfront access, top-rated schools, and a conservative-leaning lifestyle along the Eastern Shore of Mobile Bay. With 44.5% of adults holding a bachelor’s degree or higher—well above the national average—Spanish Fort has become a magnet for educated households, while its racial composition (78.2% white, 6.9% Hispanic, 6.8% Black) reflects a modestly diverse but still largely homogeneous population.
How the city was settled and grew
Spanish Fort’s human history is almost entirely a story of late-20th-century suburbanization, not colonial settlement. The site was sparsely inhabited through the 1800s and early 1900s, with a few scattered farmsteads and seasonal fishing camps. The modern city was incorporated only in 1993, and its population boom began in earnest after the completion of the Battleship Parkway (US-98) causeway in the 1960s, which connected the Eastern Shore to Mobile. The first significant wave of residents were white middle-class families moving east from Mobile to escape urban crowding and seek larger lots. These early suburbanites built homes in what is now the Lake Forest neighborhood, a master-planned community developed in the 1970s around a private lake and golf course. A second wave in the 1980s and 1990s filled out Eastern Shores, a waterfront subdivision along the Tensaw River that attracted boaters and retirees. Both neighborhoods remain predominantly white and upper-middle-class today, with home values well above the Baldwin County median.
Modern era (post-1965)
After the Hart-Cellar Act of 1965, Spanish Fort saw virtually no new immigration from abroad; its foreign-born share of 6.0% is roughly half the national average. Instead, the city’s growth has been driven entirely by domestic in-migration from other parts of Alabama and the broader Sun Belt. The 1990s and 2000s brought a surge of families from the Midwest and Northeast, drawn by lower taxes, coastal recreation, and the reputation of the Spanish Fort public schools (consistently ranked among Alabama’s top 10). These newcomers concentrated in newer subdivisions like Stonebridge and Belforest, both built on former timberland east of I-10. The Hispanic population (6.9%) is largely composed of second- and third-generation Mexican-American families who moved from Mobile or the Gulf Coast for construction and service jobs; they are dispersed across the city, with a small cluster near the Spanish Fort Town Center commercial district. The Black population (6.8%) is concentrated in older, more affordable pockets near the Belforest Road corridor, a historically rural area that was annexed into the city limits in the 2000s. East/Southeast Asian and Indian-subcontinent populations are effectively zero, reflecting the city’s lack of tech or academic anchors that typically draw those groups.
The future
Spanish Fort’s population is projected to continue growing at a moderate pace of 1–2% annually, driven by ongoing residential development along the Alabama 181 corridor and the expansion of the Eastern Shore Centre retail hub. The city is becoming slightly more diverse: the Hispanic share has risen from 4.2% in 2010 to 6.9% in 2024, and the Black share has inched up from 5.5% to 6.8% over the same period. However, the white share remains dominant and is likely to stay above 75% for the foreseeable future, as new subdivisions like Belforest Park and Spanish Fort Estates continue to market to affluent white families. The foreign-born share is unlikely to rise significantly given the absence of large employers or refugee resettlement programs. Culturally, the city is solidifying its identity as a conservative, family-first suburb with a strong emphasis on school quality, low crime, and outdoor recreation. The next 10–20 years will likely see infill development of remaining vacant parcels, but no major demographic transformation—Spanish Fort will remain a predominantly white, college-educated, and politically conservative enclave of the Eastern Shore.
For someone moving in now, Spanish Fort offers a stable, low-diversity, high-amenity suburban environment with excellent schools and a strong sense of community rooted in church, sports, and waterfront living. The population is not becoming more cosmopolitan or urban; rather, it is deepening its existing character as a safe, family-oriented haven for those who prioritize space, nature, and traditional values over cultural variety or urban energy.

* Values derived from national, state, county, city and local statistics and may differ in a specific area. Last updated: 2026-08-18T00:28:01.000Z
Narrative content on this page is AI-generated and may contain mistakes. Verify any details that matter before acting on them.
ReloMaps may earn a commission from affiliate links at no extra cost to you.

