Photo: Wikipedia
Demographics of Shipshewana, IN
Affluence Level in Shipshewana, IN
A middle-class area roughly in line with national averages across income, home values, education, and employment.
People of Shipshewana, IN
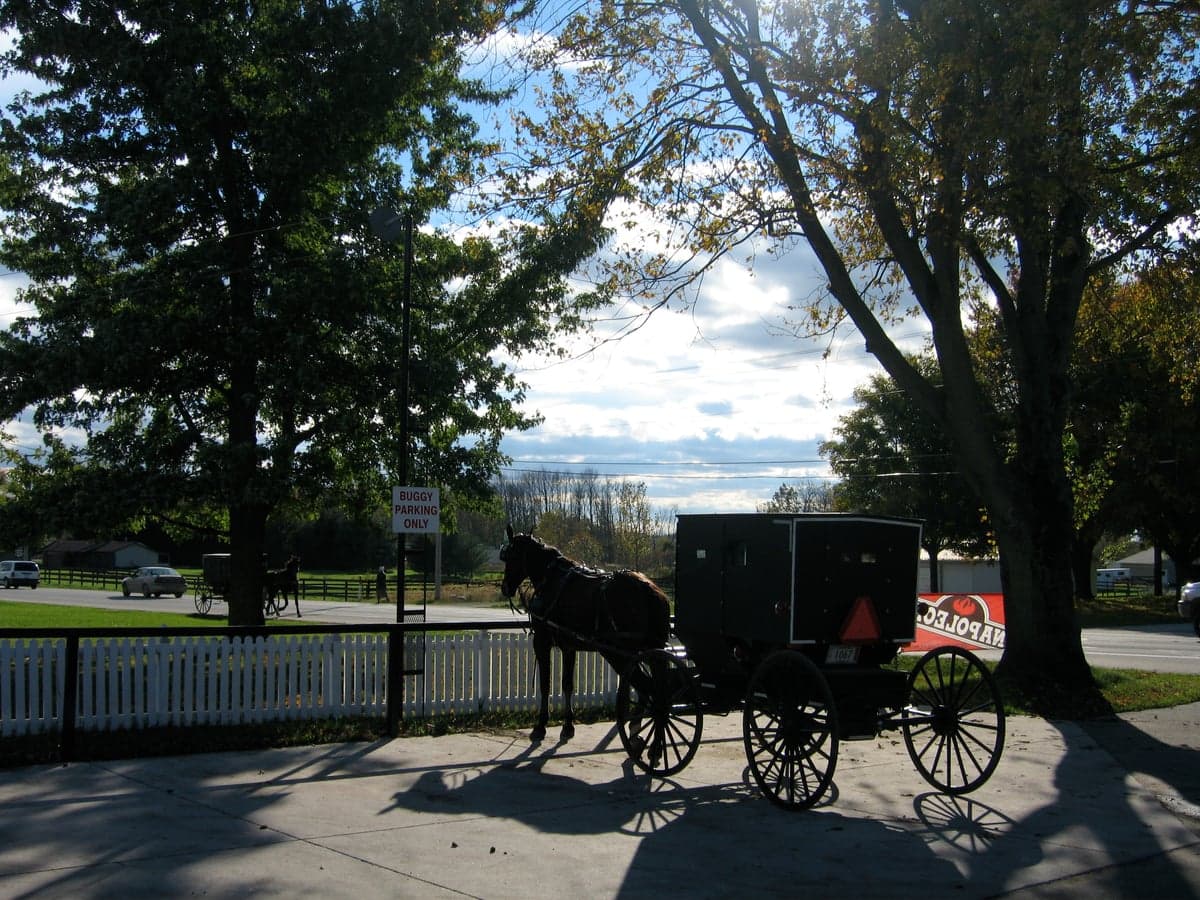
Shipshewana, Indiana, is a town of 902 residents where the population is overwhelmingly white (87.3%) and deeply rooted in the Old Order Amish and Mennonite traditions that give the town its national identity as a tourism and auction destination. The town is small, tight-knit, and culturally distinct from the surrounding LaGrange County countryside, with a character defined by horse-drawn buggies, family-owned businesses, and a strong Protestant work ethic. Only 1.2% of residents are foreign-born, and the college-educated share sits at 10.4%, reflecting a community that values vocational trades and family enterprise over four-year degrees. For a relocating family, this is a place where neighbors know each other by name and where the rhythm of life follows the agricultural calendar.
How the city was settled and grew
Shipshewana was formally platted in 1899, but its human history begins decades earlier with the arrival of the Amish. The first wave of Old Order Amish families migrated from Pennsylvania and Ohio to LaGrange County in the 1840s, drawn by cheap, fertile farmland and the promise of religious isolation from mainstream Protestant society. These early settlers established homesteads along the natural drainage lines west of the present-day town center, in an area now loosely referred to as the West End Farmsteads, where descendant families still operate dairy and crop operations today. The town itself grew around the Baltimore & Ohio Railroad depot, which arrived in the 1890s and turned the crossroads into a shipping point for grain, livestock, and lumber.
The second major wave came between 1900 and 1930, when a separate group of more progressive Amish-Mennonite families settled east of the tracks, building the modest frame homes and small workshops that today form the East Side Settlement district. These families were less insular than their Old Order neighbors and opened the first general stores, harness shops, and blacksmith forges that served the surrounding farms. The town incorporated in 1901, and by 1950 the population had stabilized at roughly 400 residents, almost entirely of Swiss-German and Pennsylvania Dutch descent. The Downtown Historic District, centered on Main Street, was built during this era and remains the commercial heart of the community, with brick storefronts now housing quilt shops, furniture makers, and restaurants catering to tourists.
Modern era (post-1965)
The post-1965 era brought little of the immigration-driven diversification seen in larger Indiana cities. Shipshewana's foreign-born population remains negligible at 1.2%, and the town's growth has come almost entirely from natural increase and domestic in-migration of Amish families from other Midwestern settlements. The most significant demographic shift has been the expansion of the Amish population itself, which has grown through high birth rates and the establishment of new church districts. This growth has pushed residential development into the North Ridge Addition, a post-1980 subdivision of single-family homes on the town's northern edge, where younger Amish and Mennonite families have built modern homes while maintaining traditional farming practices on adjacent parcels.
The Hispanic population, now 4.1%, is a recent and small addition, primarily composed of a few families who arrived in the 2000s to work in the recreational vehicle manufacturing plants in nearby Middlebury and Goshen. These households have settled in rental properties along the Southwest Corridor, near the town's light-industrial zone, rather than in the established Amish neighborhoods. The Black population (1.9%) and East/Southeast Asian population (0.0%) are negligible, and there is no measurable Indian-subcontinent community. The town's racial and ethnic character is therefore remarkably stable, with the Amish and Mennonite population continuing to dominate every neighborhood and civic institution.
The future
The demographic trajectory of Shipshewana points toward continued cultural homogeneity rather than diversification. The Amish population in LaGrange County is growing at roughly 3-4% annually, and this growth is expected to push the town's overall population past 1,100 by 2040, even as the non-Amish share remains flat or declines slightly. New residential development is concentrating in the East Side Settlement and North Ridge Addition, where land is available for the large homes and outbuildings that Amish families require. The Hispanic share may grow modestly as manufacturing employment in the broader Elkhart-Goshen region attracts more workers, but these families are more likely to settle in larger towns like Goshen or Middlebury than in Shipshewana proper.
The cultural identity of the town is unlikely to shift meaningfully. The tourism economy, anchored by the Shipshewana Auction and the Menno-Hof museum, will continue to define the town's public face, while the private life of the community remains governed by Amish church ordinances and Mennonite civic values. The college-educated share may rise slightly as tourism management and healthcare jobs attract outsiders, but the town will remain a place where high school graduation and vocational apprenticeship are the normative paths for young people.
For someone moving to Shipshewana today, the bottom line is this: you are entering one of the most culturally stable and demographically homogeneous small towns in the Midwest. The population is growing, but it is growing through Amish family expansion, not through immigration or urban flight. The practical implications are straightforward — housing is affordable, crime is minimal, and the community is welcoming to newcomers who respect local customs, but the diversity of a larger city will not be found here. The next two decades will likely look very much like the last two, with the Amish and Mennonite character of the town deepening rather than diluting.

* Values derived from national, state, county, city and local statistics and may differ in a specific area. Last updated: 2026-10-31T19:15:41.000Z
Narrative content on this page is AI-generated and may contain mistakes. Verify any details that matter before acting on them.
ReloMaps may earn a commission from affiliate links at no extra cost to you.

