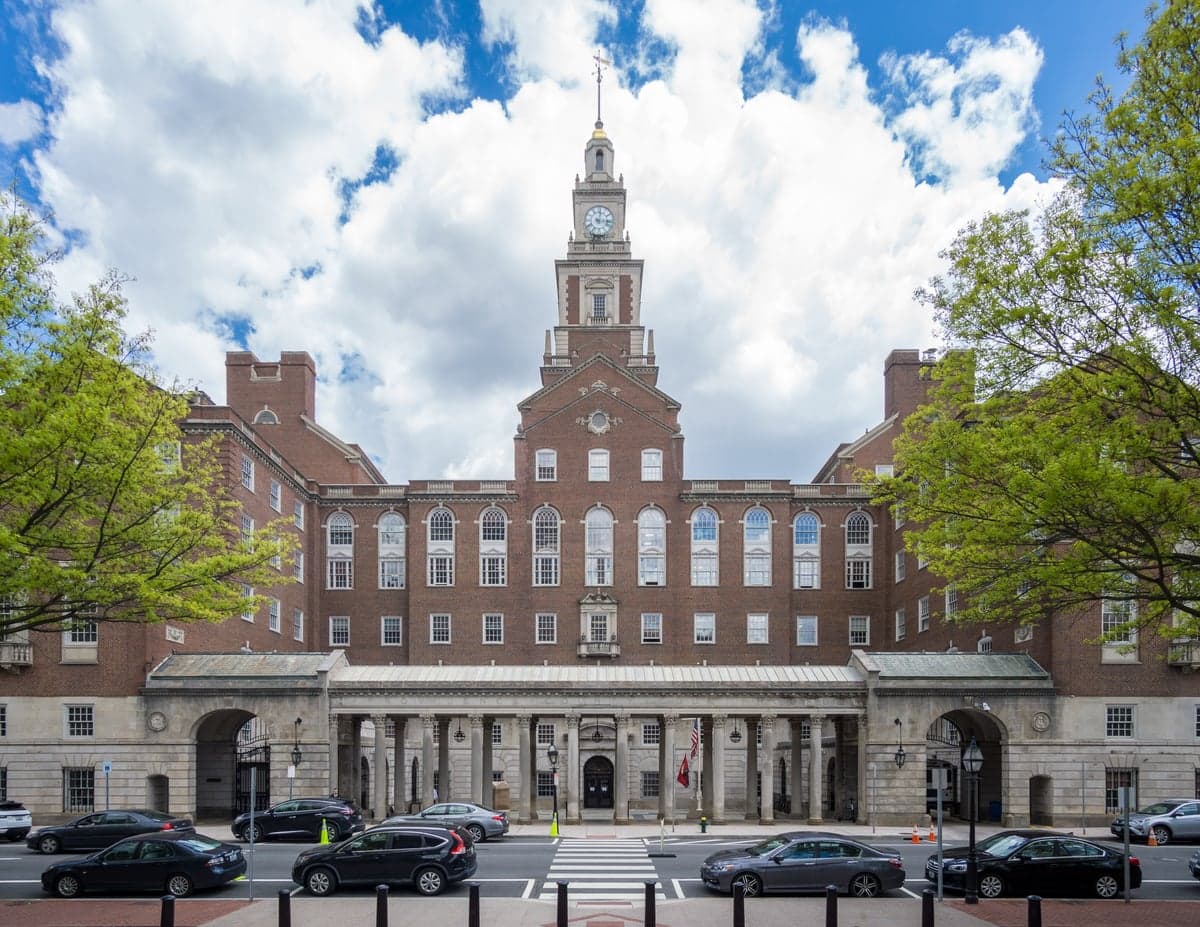
Photo: Wikipedia
Quality of Life in Providence County
A livable area that tracks near national norms for affordability, walkability, and neighborhood health.
What does Quality of Life tell us?
Quality of Life measures an area by evaluating factors like cost of living, nearby amenities, country club access, airport proximity, socioeconomic signals and neighborhood character. For large states, this is a general average — quality of life can vary dramatically between metro areas, suburbs, and rural communities within the same state.
What does this tell us?
Quality of Life measures an area by evaluating factors like cost of living, nearby amenities, country club access, airport proximity, socioeconomic signals and neighborhood character. For large states, this is a general average — quality of life can vary dramatically between metro areas, suburbs, and rural communities within the same state.
Cost of Living
12% above national average
81%
The Real Cost of Living in Providence County for 2026
| Tier | Individual | Family (4) |
|---|---|---|
| Survival | $20k | $37k |
| Comfortable | $66k | $97k |
| Luxury | $136k+ | $211k+ |
| Elite (Top 5%) | $160k+ | $249k+ |
Quality-of-Life Analysis
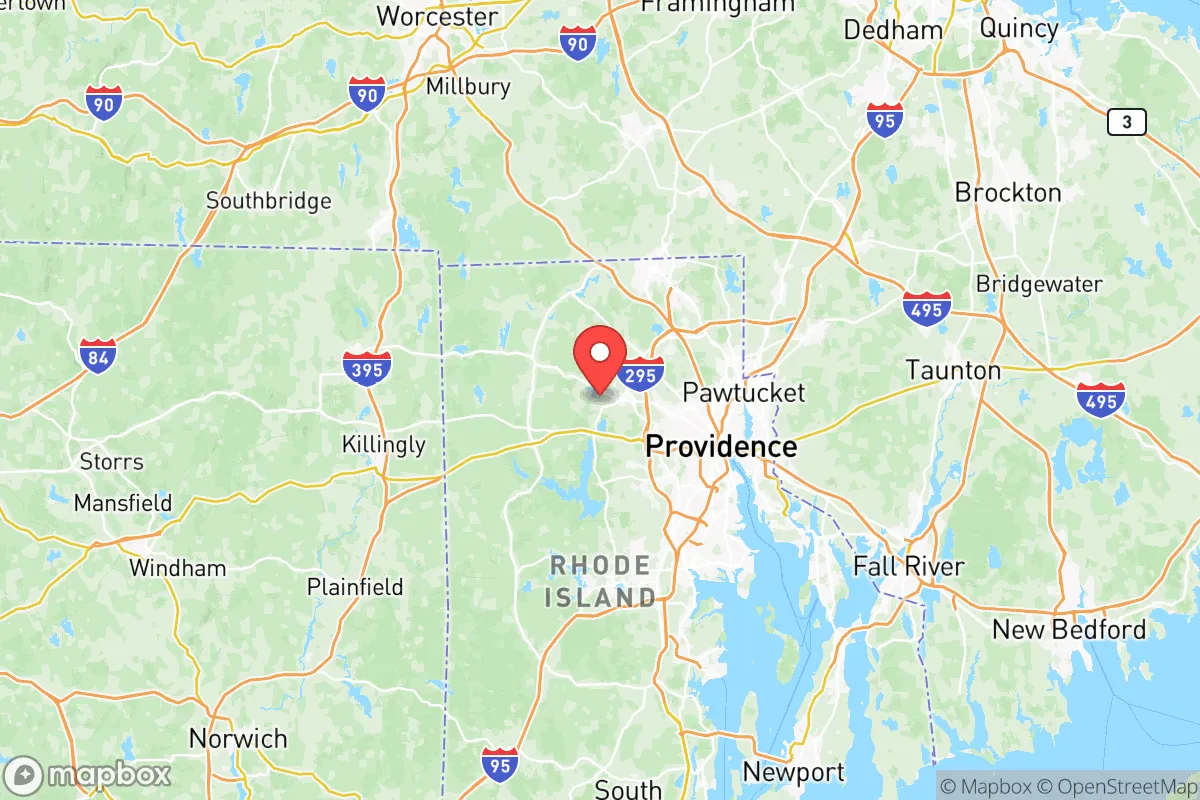
Providence County, Rhode Island, offers a quality-of-life spectrum that spans from dense, walkable urban centers to quiet, wooded rural hamlets, drawing everyone from young professionals and students to families seeking space and retirees looking for affordability. The county’s cost of living index of 112 (100 = U.S. average) and median home value of $339,100 place it slightly above the national norm, but the range of options means buyers and renters can find dramatically different price points and lifestyles within a 20-minute drive. With an average commute of 25.6 minutes, the county balances access to Providence’s job market with the ability to live in settings that feel far removed from city bustle.
Largest town(s) & population centers
Providence, the state capital and county seat, is the clear anchor, with a population over 190,000. Daily life here is defined by walkable neighborhoods like the East Side (home to Brown University and the Rhode Island School of Design), Federal Hill (known for Italian cuisine and nightlife), and the resurgent Olneyville area. The city offers a robust arts scene, the Providence Performing Arts Center, and WaterFire events along the rivers. Pawtucket, immediately north, is a dense, historic mill city undergoing revitalization around the Pawtucket-Central Falls Transit Center and the new Tidewater Landing soccer stadium. Cranston, the county’s second-largest city, offers a more suburban feel with good public schools and the sprawling Garden City Center shopping complex. Woonsocket, in the northern corner, is a former mill hub with a strong Franco-American heritage and lower home prices, attracting first-time buyers. These population centers share a median rent of $1,242, but rents in Providence’s East Side can exceed $1,800, while Woonsocket often falls below $1,000.
Smaller towns & rural pockets
Beyond the urban core, Providence County contains distinct smaller communities. North Providence and Johnston are essentially inner-ring suburbs with modest single-family homes and local commercial strips, offering a quieter alternative to city living. Lincoln and Cumberland (both in the Blackstone River Valley) blend historic mill villages like Lonsdale and Valley Falls with newer subdivisions and preserved woodlands, including Lincoln Woods State Park. Smithfield is home to Bryant University and retains a semi-rural feel with horse farms and the sprawling 1,200-acre Pulaski State Park. The most rural pockets are found in Glocester and Burrillville, in the county’s northwest corner. Glocester’s villages of Chepachet and Harmony feature antique shops, working farms, and the 3,000-acre George Washington Management Area. Burrillville, with the villages of Pascoag and Harrisville, offers lakefront properties on Spring Lake and Bowdish Reservoir, plus extensive hiking at Buck Hill Management Area. These towns have no major employers, so residents commute 30–40 minutes to Providence or into Massachusetts.
Cost & lifestyle range
The cost-of-living spread across Providence County is wide. At the high end, East Side of Providence and parts of Cumberland near the Massachusetts border see median home values above $450,000, with some properties exceeding $600,000. These areas offer top-rated schools (e.g., Cumberland High School, Wheeler School), walkable village centers, and proximity to Brown University’s cultural amenities. At the low end, Central Falls (a separate city within the county) and Woonsocket have median home values around $250,000–$280,000, with rents often below $1,000. Central Falls is the most densely populated city in Rhode Island, with a strong immigrant community and limited green space, but it offers the lowest entry point for homeownership in the county. Johnston and North Providence sit in the middle, with typical homes in the $320,000–$370,000 range and property taxes that are slightly lower than Providence’s. Lifestyle varies accordingly: urban dwellers in Providence and Pawtucket walk to restaurants and public transit, while residents in Glocester or Burrillville rely on cars for every errand but enjoy privacy, low crime rates, and direct access to state parks.
This county works best for people who value variety within a compact region. Young professionals and students gravitate to Providence’s urban energy; families with school-age children often choose Cranston, Cumberland, or Lincoln for their school systems and suburban amenities; and those seeking affordable acreage or lake living find value in Burrillville and Glocester. The 25.6-minute average commute means that even the most rural residents can reach downtown Providence in under 40 minutes, making the trade-off between space and convenience unusually balanced. For anyone who wants the option of a city loft, a suburban colonial, or a farmhouse on five wooded acres—all within one county—Providence County delivers that range without requiring a cross-state move.
Crime in Providence County
Lower crime rates than 76% of comparable U.S. locations.
Violent CrimeViolent Crime Analysis
Property CrimeProperty Crime Analysis
Crime Analysis
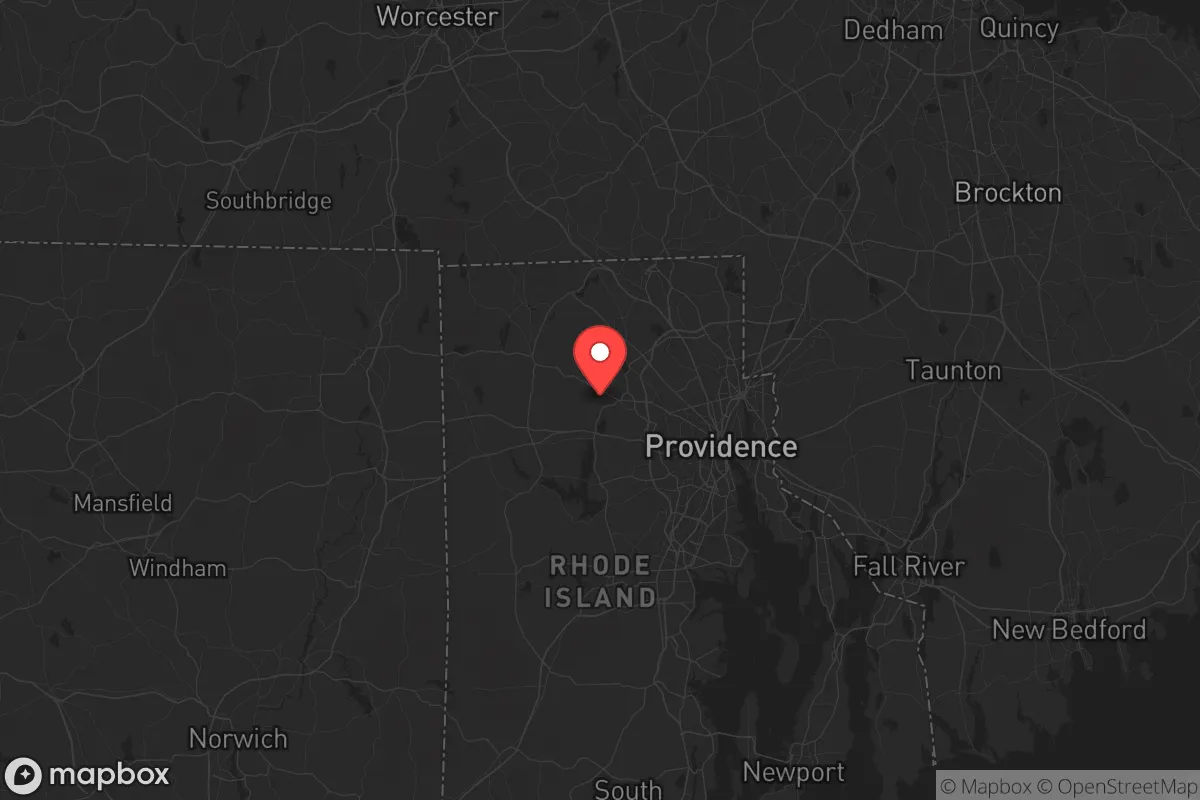
Providence County, Rhode Island, presents a mixed safety profile that varies dramatically depending on which of its 39 cities and towns a resident calls home. The county’s overall violent crime rate stands at 140.1 per 100,000 residents, while property crime registers at 879.5 per 100,000. These figures mask a stark divide between the urban core—dominated by Providence, Pawtucket, and Central Falls—and the more suburban and rural communities like East Greenwich, Cumberland, and Foster, where crime is far less common.
Crime in context
Providence County’s violent crime rate of 140.1 per 100,000 is roughly 60% lower than the national average of about 380 per 100,000, placing it among the safer large counties in the Northeast. Property crime, however, at 879.5 per 100,000, sits closer to the national average of approximately 1,950 per 100,000, meaning residents face a moderate risk of theft, burglary, and vehicle break-ins. Compared to the rest of Rhode Island, Providence County’s rates are elevated because it contains the state’s largest and most densely populated cities. Neighboring Bristol County, for example, reports significantly lower violent crime, while Kent County falls between the two. The county’s figures are heavily influenced by the high-crime environments of Providence, Pawtucket, and Central Falls, which together account for a disproportionate share of reported incidents.
What residents experience
Daily life in Providence County’s safer towns feels markedly different from the urban centers. In East Greenwich, Cumberland, and North Smithfield, residents typically report feeling secure walking at night and leaving doors unlocked, with property crime being the primary concern. In contrast, residents of Providence’s South Side, Olneyville, and parts of Pawtucket frequently cite gun violence, drug-related incidents, and gang activity as persistent worries. The county’s property crime is largely opportunistic—car break-ins, package thefts, and home burglaries—concentrated near transit corridors and commercial districts. A notable factor affecting public safety is the progressive orientation of the judicial system in Providence County. The Providence County Superior Court and the office of the District Attorney have, in recent years, emphasized diversion programs, reduced cash bail, and alternative sentencing for non-violent offenders. While intended to reduce incarceration, critics argue this approach has led to repeat offenders cycling back onto the streets quickly, undermining deterrence and leaving victims feeling justice is incomplete. This is especially concerning in Providence and Pawtucket, where property crime recidivism is a documented issue.
Neighborhood-level variation
The safety landscape within Providence County is not uniform. The city of Providence itself sees violent crime rates roughly three times the county average, with hotspots in the West End, Elmwood, and the area around Kennedy Plaza. Pawtucket and Central Falls also report elevated rates, though they are lower than Providence’s worst neighborhoods. Conversely, Foster, Scituate, and Glocester are among the safest rural towns in the state, with violent crime rates near zero and property crime well below the county norm. Cranston and Warwick occupy a middle ground: generally safe but with property crime rates that mirror the county average, particularly near shopping plazas and highway exits. For those relocating, choosing a town like East Greenwich or Cumberland offers a markedly different safety experience than settling in the urban core, where progressive judicial policies have a more direct impact on daily life. Prospective residents should research specific neighborhoods and consider that the county’s overall statistics do not reflect the reality of any single community.
* Values derived from national, state, county, city and local statistics and may differ in a specific area. Last updated: 2026-05-12T04:33:20.000Z
Narrative content on this page is AI-generated and may contain mistakes. Verify any details that matter before acting on them.
ReloMaps may earn a commission from affiliate links at no extra cost to you.