
Photo: Wikipedia
Demographics of Port Orchard, WA
Affluence Level in Port Orchard, WA
A middle-class area roughly in line with national averages across income, home values, education, and employment.
People of Port Orchard, WA
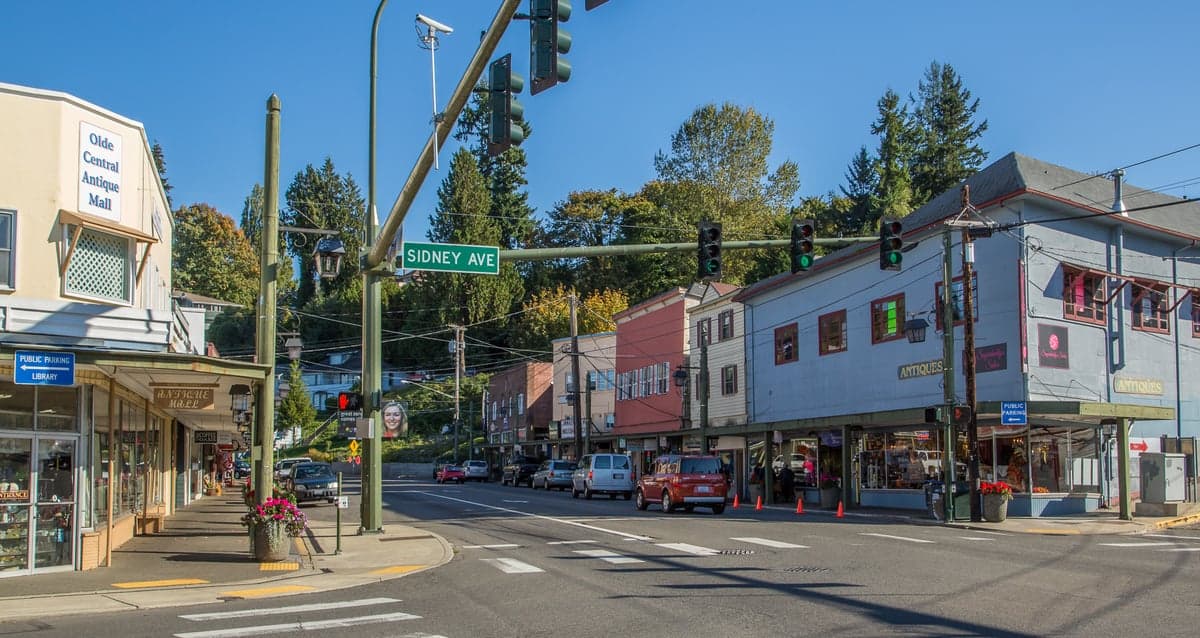
The people of Port Orchard, Washington, today number roughly 16,400, forming a predominantly white (71.4%) and increasingly Hispanic (11.7%) community with a small but notable East and Southeast Asian presence (4.0%). The city’s identity is shaped by its working-class naval heritage, a growing bedroom-community role for Bremerton’s Puget Sound Naval Shipyard, and a modest but rising share of college-educated residents (32.2%). With a foreign-born population of just 3.1%, Port Orchard remains less diverse than the national average, but its demographic character is slowly shifting as new residents arrive from within Washington state and the broader West Coast.
How the city was settled and grew
Port Orchard’s population history begins with the Suquamish people, who inhabited the shoreline for millennia before European contact. The first permanent white settlers arrived in the 1850s, drawn by the deep-water harbor and abundant timber. The city’s original plat was filed in 1886 by Frederick Stevens, a sawmill operator, and the early economy centered on logging, shingle mills, and shipbuilding. The Bay Street district, now the historic downtown core, became the commercial hub for Scandinavian and German immigrant families who worked the mills and docks. A second wave arrived during World War I and the 1920s, when the Puget Sound Naval Shipyard in Bremerton expanded, pulling workers into neighborhoods like South Park and McCormick Woods (then farmland). These early residents were overwhelmingly white, with small pockets of Japanese American families who worked in truck farming until forced removal during World War II. By 1950, Port Orchard’s population hovered around 2,500, still a quiet mill-and-ferry town.
Modern era (post-1965)
The post-1965 period brought two major shifts. First, the 1970s and 1980s saw a wave of domestic in-migration from other parts of Washington and California, as defense spending at the shipyard boomed. New subdivisions like Bethel and East Port Orchard filled with families seeking affordable waterfront-adjacent housing. These newcomers were predominantly white, but the area also absorbed a small number of Filipino and Vietnamese families—many with ties to the U.S. Navy—who settled in the Tremont Street corridor. Second, the 1990s and 2000s brought a steady increase in Hispanic residents, primarily of Mexican origin, drawn by construction and service jobs in the growing Kitsap County economy. Today, Hispanic residents (11.7%) are concentrated in the East Port Orchard and South Park neighborhoods, while East and Southeast Asian residents (4.0%) are more dispersed but have a visible presence near the waterfront. The Black population remains very small (1.2%), and the Indian-subcontinent population is negligible (0.0%). The city’s college-educated share (32.2%) has risen from roughly 20% in 2000, reflecting the arrival of remote workers and retirees from the Seattle area.
The future
Port Orchard’s population is projected to grow modestly, likely reaching 18,000–19,000 by 2040, driven by spillover from the Seattle-Tacoma metro area and the expansion of the Washington State Ferry system. The Hispanic share is expected to continue rising, potentially reaching 15–18% by 2040, as younger families move into Bethel and McCormick Woods subdivisions. The white share will decline gradually but remain the majority. East and Southeast Asian communities are likely to grow slowly, while the Black and Indian-subcontinent populations are expected to remain small unless major employers (such as the shipyard or the new St. Michael Medical Center) recruit more diversely. The city’s cultural identity is evolving from a blue-collar naval town into a more mixed-income bedroom community, with new retail and multifamily development along Sedgwick Road and Lund Avenue. The foreign-born share (3.1%) may rise slightly but will stay well below the national average, as Port Orchard lacks the ethnic enclaves and immigration networks of larger cities.
For someone moving in now, Port Orchard offers a predominantly white, family-oriented community with a growing Hispanic minority and a quiet, suburban feel. The city is becoming slightly more diverse and more educated, but it remains a place where most residents are native-born and where the dominant cultural touchstones are naval service, outdoor recreation, and proximity to Seattle without the urban intensity. New arrivals will find a community in gradual transition, not rapid transformation.

* Values derived from national, state, county, city and local statistics and may differ in a specific area. Last updated: 2026-09-24T15:02:11.000Z
Narrative content on this page is AI-generated and may contain mistakes. Verify any details that matter before acting on them.
ReloMaps may earn a commission from affiliate links at no extra cost to you.

