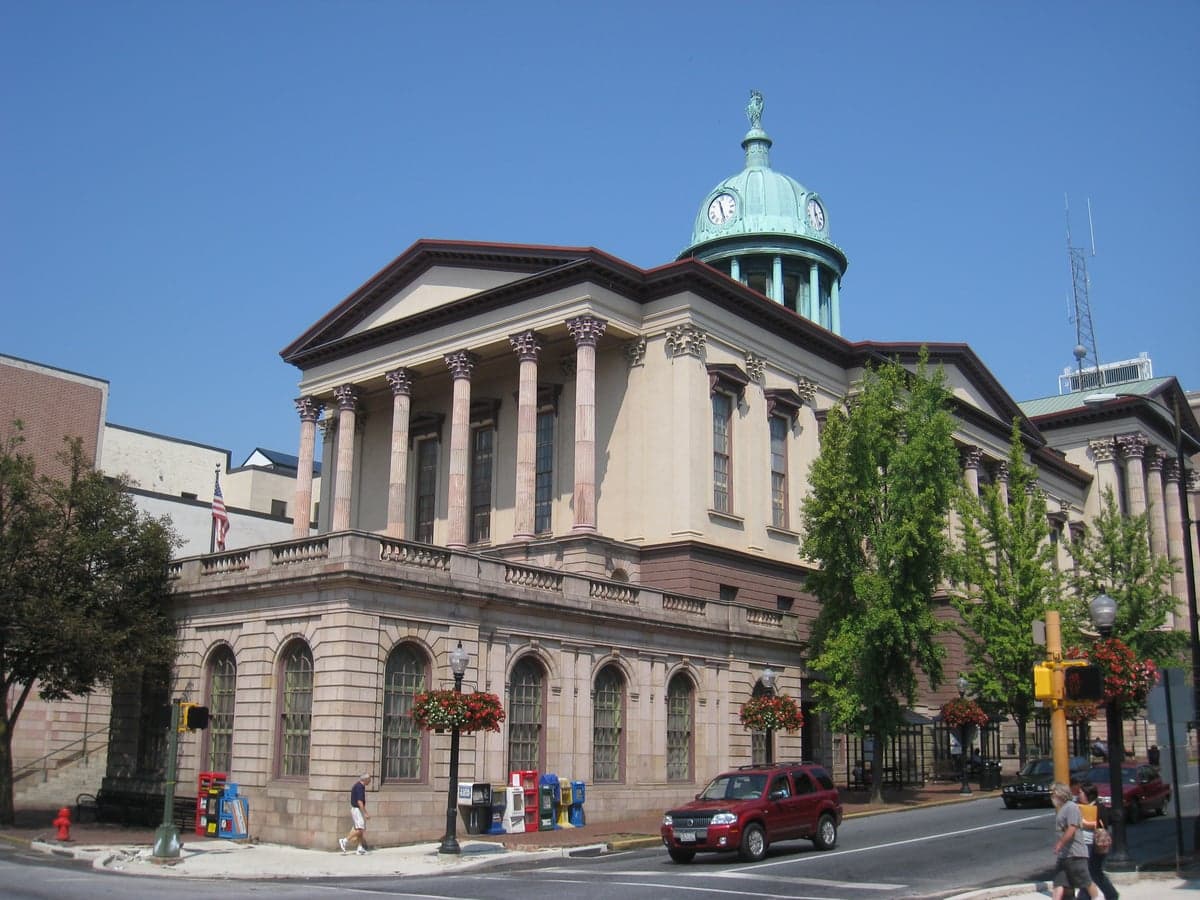
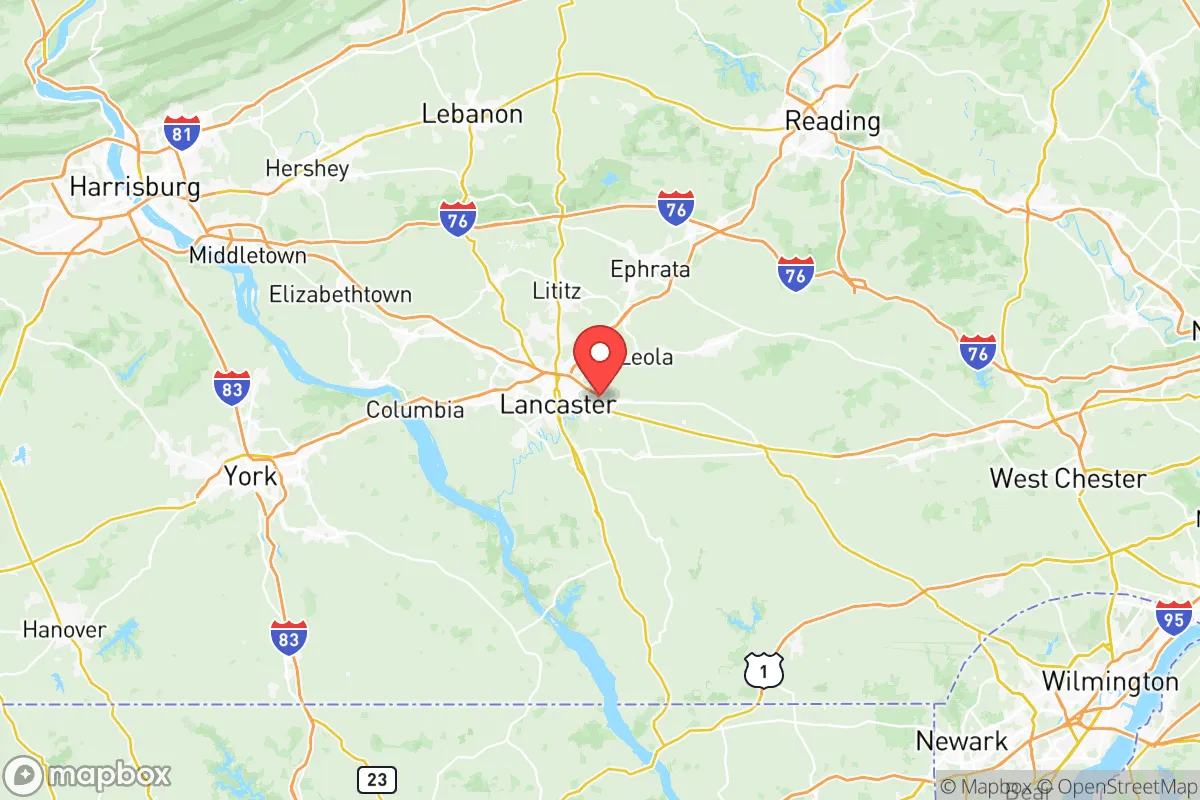
Photo: Wikipedia
Quality of Life in Lancaster County
A livable area that tracks near national norms for affordability, walkability, and neighborhood health.
What does Quality of Life tell us?
Quality of Life measures an area by evaluating factors like cost of living, nearby amenities, country club access, airport proximity, socioeconomic signals and neighborhood character. For large states, this is a general average — quality of life can vary dramatically between metro areas, suburbs, and rural communities within the same state.
What does this tell us?
Quality of Life measures an area by evaluating factors like cost of living, nearby amenities, country club access, airport proximity, socioeconomic signals and neighborhood character. For large states, this is a general average — quality of life can vary dramatically between metro areas, suburbs, and rural communities within the same state.
Cost of Living
6% above national average
105%
The Real Cost of Living in Lancaster County for 2026
| Tier | Individual | Family (4) |
|---|---|---|
| Survival | $21k | $39k |
| Comfortable | $54k | $80k |
| Luxury | $140k+ | $217k+ |
| Elite (Top 5%) | $165k+ | $255k+ |
Quality-of-Life Analysis
Lancaster County, Pennsylvania offers a quality-of-life spectrum that ranges from the walkable urban core of its historic seat to the tranquil farmland of its Amish Country hinterlands, attracting everyone from young professionals and empty nesters to traditional farming families and remote workers. With a cost-of-living index of 106 (slightly above the national average), a median home value of $279,400, and a median rent of $1,289, the county provides a relatively affordable alternative to Philadelphia or the New York metro area while maintaining strong economic and cultural assets. The 23.98-minute average commute is notably short for a county of its population density, making it feasible to choose a rural home and work in a town center.
Largest town(s) & population centers
The city of Lancaster (pop. ~55,000) serves as the county's primary urban hub, offering a dense, walkable downtown with the Lancaster Central Market (the nation's oldest continuously operating public market), a thriving arts scene anchored by the Lancaster Museum of Art, and a growing roster of breweries and farm-to-table restaurants. Daily life here is distinctly pedestrian and bike-friendly, with a grid of historic rowhomes, condominiums, and apartment buildings that attract a mix of young professionals, Millennials, and empty nesters downsizing from suburban homes. Just northeast, Manheim Township (pop. ~43,000) functions as the county's primary suburban bedroom community, with large single-family subdivisions, the Park City Center mall, and highly rated public schools (Manheim Township School District consistently ranks among the top in the county). Lancaster Township, wrapping the city's southern and western edges, provides a middle ground—older homes on tree-lined streets with easy access to downtown amenities without the city's property taxes.
Smaller towns & rural pockets
Beyond the immediate Lancaster metro, a ring of historic small towns offers a quieter, more community-centric lifestyle. Lititz (pop. ~9,500), frequently named among the "Best Small Towns in America," features a walkable downtown with boutique shops, the Wilbur Chocolate Company museum, and a strong sense of civic pride centered around the Lititz Springs Park and frequent community events like the annual Fourth of July celebration. Mount Joy (pop. ~9,000) and Elizabethtown (pop. ~12,000) offer similar small-town charm with active main streets, local diners, and rail trails connecting to the broader county network. Further out, the village of Intercourse and the Borough of Strasburg sit within the heart of Amish Country, where daily life is defined by horse-drawn buggies on two-lane roads, family-owned farm stands, and the Strasburg Rail Road tourist railroad. These areas are overwhelmingly rural, with large tracts of preserved farmland and minimal commercial development beyond farm markets and roadside produce stands.
Cost & lifestyle range
The cost-of-living index of 106 masks significant variation across the county's communities. At the higher end, Manheim Township and Lititz command median home prices often exceeding $350,000, driven by high-demand school districts, proximity to Lancaster city, and limited inventory. The lifestyle here is oriented around schools, parks, and family-oriented amenities—weekends might include a visit to the Lititz Farmers Market, a concert at the Lancaster County Convention Center, or a hike at the nearby Chickies Rock County Park. At the more affordable end, rural townships such as Colerain Township, Bart Township, and Drumore Township in the county's southern and eastern reaches offer median home values below $200,000, often on larger lots with lower property tax rates. Renters find the best deals in small towns like Columbia (pop. ~10,000), where median rent hovers around $900 and the Susquehanna River provides a scenic backdrop. The trade-off in more rural pockets: fewer restaurants, longer drives to grocery stores (often 15-20 minutes), and reliance on private wells and septic systems.
The spectrum of quality-of-life options in Lancaster County means that a wide range of residents can find a fit—whether that's a young family seeking a strong school district in Manheim Township, a retiree wanting walkable historic charm in Lititz, an artist drawn to the creative energy of Lancaster city, or a farmer valuing land access and quiet in Colerain Township. The county's short average commute and moderate cost-of-living index make it feasible to live in one of these zones and work in another, allowing residents to tailor their daily experience to their individual priorities without paying a premium for proximity to a major metropolitan center.

Crime in Lancaster County
WARNING: The crime statistics are unreliable for this jurisdiction. Local authorities have either not reported or under reported their data to the FBI. This could be due to bad intentions, incompetence or technical issues. Regardless, we suggest skepticism.
Higher crime rates than 62% of comparable U.S. locations.
Violent CrimeViolent Crime Analysis
Property CrimeProperty Crime Analysis
Crime Analysis
Lancaster County, Pennsylvania, maintains a safety profile that is broadly consistent with national averages, though property crime rates are a point of concern for residents moving to the area. According to the most recent crime data, the county reports a violent crime rate of 226.5 incidents per 100,000 residents, while the property crime rate stands at 1,346.4 per 100,000. These figures place the county in a precarious middle ground—safer than many urban cores in the Northeast, yet with property crime rates that demand attention from prospective homeowners and renters alike.
Crime in context
When measured against both Pennsylvania state and national benchmarks, Lancaster County's violent crime rate is roughly on par with the national average of approximately 230 per 100,000, though it is slightly lower than the overall Pennsylvania state rate. The property crime rate, however, runs meaningfully higher than the national average near 1,200 per 100,000. Neighboring Chester County, to the east, reports a violent crime rate of just 147 per 100,000, while York County to the west posts a rate near 290, placing Lancaster in the middle of its immediate region. The city of Lancaster itself contributes a disproportionate share of the county's reported violent crime—much of it concentrated in blocks east of the city core. Townships such as Manheim Township and East Hempfield Township experience markedly lower violent crime rates, often below 100 per 100,000, making them common choices for families seeking safer suburban environments.
What residents experience
For the average resident, the most tangible safety issue is property crime—specifically motor vehicle theft and package theft, which have risen notably since 2022. Many newer subdivisions in the county, particularly in the broader Lititz and Mount Joy areas, report vehicle break-ins and garage entries, often linked to transient groups traveling the Pennsylvania Turnpike corridor. Violent crime, by contrast, is largely non-random: in Lancaster City, roughly 70% of aggravated assaults involve individuals who know each other, often tied to disputes or domestic incidents. Prosecution patterns in the county's judicial system have been a point of contention in recent years. The Lancaster County District Attorney's Office operates under a generally conservative approach to sentencing, but progressive-leaning policies in nearby Philadelphia and Dauphin County (Harrisburg) have drawn criticism from law enforcement officials, who argue that lenient bail and plea deals in those jurisdictions allow repeat offenders to cycle back into communities, including parts of northern Lancaster County near the county line. Residents living near the boroughs of Columbia and Elizabethtown should be aware that cross-jurisdictional crime patterns, including stolen vehicles and drug trafficking, are influenced by these broader regional trends.
Neighborhood-level variation in Lancaster County is pronounced and easily observable. The safest communities by reported index crime are Leacock Township, East Lampeter Township, and Warwick Township, all of which consistently log violent crime rates below 80 per 100,000. By contrast, the City of Lancaster and the boroughs of Columbia and Ephrata see elevated rates, with property crime in Columbia reaching nearly 2,100 per 100,000—roughly 1.5 times the county average. For transplants relocating from high-crime metro areas, Lancaster County’s overall numbers may feel manageable, but the gap between the safest townships and the riskier boroughs is wide enough to merit careful neighborhood research. New developments in Willow Street and Lampeter offer a balanced compromise—low violent crime with acceptable property crime figures—while maintaining proximity to the city's employment base and cultural amenities.
* Values derived from national, state, county, city and local statistics and may differ in a specific area. Last updated: 2026-07-01T23:49:38.000Z
Narrative content on this page is AI-generated and may contain mistakes. Verify any details that matter before acting on them.
ReloMaps may earn a commission from affiliate links at no extra cost to you.

