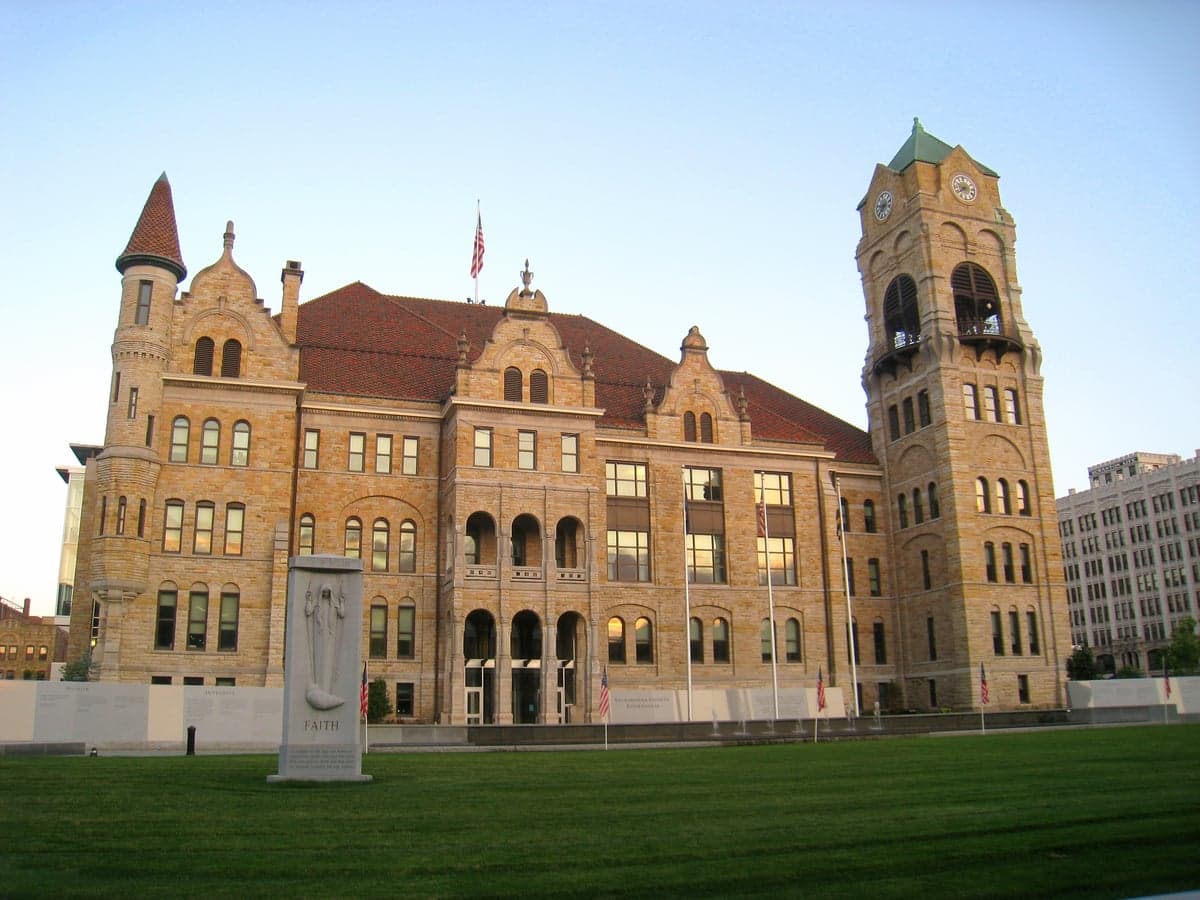
Photo: Wikipedia
Quality of Life in Lackawanna County
A livable area that tracks near national norms for affordability, walkability, and neighborhood health.
What does Quality of Life tell us?
Quality of Life measures an area by evaluating factors like cost of living, nearby amenities, country club access, airport proximity, socioeconomic signals and neighborhood character. For large states, this is a general average — quality of life can vary dramatically between metro areas, suburbs, and rural communities within the same state.
What does this tell us?
Quality of Life measures an area by evaluating factors like cost of living, nearby amenities, country club access, airport proximity, socioeconomic signals and neighborhood character. For large states, this is a general average — quality of life can vary dramatically between metro areas, suburbs, and rural communities within the same state.
Cost of Living
23% below national average
119%
The Real Cost of Living in Lackawanna County for 2026
| Tier | Individual | Family (4) |
|---|---|---|
| Survival | $16k | $29k |
| Comfortable | $37k | $54k |
| Luxury | $117k+ | $181k+ |
| Elite (Top 5%) | $138k+ | $215k+ |
Quality-of-Life Analysis
Lackawanna County offers a broad spectrum of quality-of-life options, from the dense, walkable urban core of Scranton to the quiet, wooded hills of its northern and western townships. The county’s character shifts noticeably as you move outward from the Lackawanna River Valley, attracting everyone from young professionals seeking city amenities to families and retirees looking for space and lower taxes. With a cost of living index of 77 — well below the national average of 100 — and a median home value of $189,900, the county provides an unusually wide range of housing and lifestyle choices within a compact geographic area.
Largest town(s) & population centers
Scranton, the county seat and largest city, anchors the region with a population of roughly 76,000. Daily life here centers on a revitalized downtown with the Steamtown National Historic Site, the University of Scranton, and a growing arts and dining scene along Lackawanna Avenue. The city offers the most rental options — median rent is $973 — and the shortest average commute in the county at around 18 minutes. Dunmore, a borough of about 14,000 directly east of Scranton, feels like a quieter, more residential extension of the city, with its own school district and a mix of older single-family homes and newer townhouses. Carbondale, the county’s second-largest city (pop. ~8,800), sits 16 miles north and has a more industrial, working-class character, with lower home prices often under $150,000 and a slower pace of life. These population centers provide the county’s densest concentration of jobs, retail, and public transit, but also carry higher property taxes and older housing stock.
Smaller towns & rural pockets
Beyond the urban core, Lackawanna County’s smaller communities offer distinct identities. Clarks Summit (pop. ~5,000) in the Abington Heights area is a classic small-town borough with a walkable main street, strong schools, and a median home value closer to $250,000. Dalton and Factoryville, further north, are even smaller villages surrounded by farmland and state game lands, attracting outdoor enthusiasts who hunt, fish, and hike in nearby Lackawanna State Park. In the western part of the county, Archbald and Blakely are former mining boroughs that now offer affordable starter homes — often under $175,000 — and a strong sense of community with local fire companies and social clubs. The most rural pockets lie in Newton Township, Jefferson Township, and Clinton Township, where homes sit on one- to five-acre lots along winding roads, and the nearest grocery store may be a 15-minute drive. These areas have no municipal water or sewer, but property taxes are significantly lower than in Scranton or Dunmore.
Cost & lifestyle range
The cost of living in Lackawanna County varies dramatically by location. At the low end, Carbondale and parts of Scranton’s South Side have median home values around $120,000–$140,000, with rents under $800 for a two-bedroom apartment. These areas offer the most affordable entry points but often come with older infrastructure and higher crime rates in certain blocks. At the high end, Clarks Summit, Waverly, and South Abington Township see median home values of $280,000–$350,000, with newer subdivisions and larger lots. The average commute across the county is just over 21 minutes, but residents in rural Greenfield Township or Madison Township may drive 30–35 minutes to reach Scranton for work or shopping. Amenities follow the same gradient: Scranton and Dunmore have hospitals, universities, and national retailers, while smaller towns rely on local diners, hardware stores, and volunteer fire departments. Property tax rates are highest in Scranton (around 2.5% of assessed value) and lowest in rural townships (often under 1.5%), which can swing monthly housing costs by $200–$400.
Lackawanna County best suits people who value choice and are willing to trade off between urban convenience, suburban schools, or rural quiet. Young renters and first-time buyers find the most opportunity in Scranton and Carbondale, while families with children often gravitate to the Abington Heights or North Pocono school districts. Retirees and remote workers seeking land and lower taxes tend to settle in the northern and western townships. The county’s diversity of settings — all within a 30-minute drive — makes it a rare place where a single region can accommodate a wide range of budgets and lifestyles without requiring a long commute.

Crime in Lackawanna County
WARNING: The crime statistics are unreliable for this jurisdiction. Local authorities have either not reported or under reported their data to the FBI. This could be due to bad intentions, incompetence or technical issues. Regardless, we suggest skepticism.
Higher crime rates than 62% of comparable U.S. locations.
Violent CrimeViolent Crime Analysis
Property CrimeProperty Crime Analysis
Crime Analysis
Lackawanna County, Pennsylvania, presents a mixed safety picture that is heavily influenced by the urban core of Scranton and the contrasting dynamics of its surrounding boroughs and townships. The county’s violent crime rate of 227.4 incidents per 100,000 residents is notably lower than the national average, but its property crime rate of 1,349.7 per 100,000 exceeds the national figure, indicating that theft and burglary are more pressing concerns for most residents. The overall safety experience varies dramatically depending on whether one lives in a dense city ward, a suburban township like South Abington, or a rural community like Dalton.
Crime in context
When compared to both Pennsylvania and national benchmarks, Lackawanna County’s violent crime rate is a relative bright spot. The national violent crime rate hovers around 380 per 100,000, meaning the county is roughly 40% safer in terms of violent offenses. However, the property crime rate of 1,349.7 per 100,000 sits above the Pennsylvania state average of approximately 1,200 per 100,000 and is closer to the national average of 1,954 per 100,000. This suggests that while residents are less likely to face a violent confrontation, they face an elevated risk of having a car broken into, a package stolen from a porch, or a home burglarized. The county’s crime index is largely pulled upward by Scranton, which accounts for a disproportionate share of both violent and property offenses relative to its population.
What residents experience
Daily life in Lackawanna County is generally safe, but the experience is not uniform. In Scranton, the county seat and largest city, residents contend with higher rates of drug-related crime, including opioid trafficking and associated thefts. The city’s police department has struggled with staffing shortages, and the progressive policies of the Lackawanna County District Attorney’s office—which has emphasized diversion programs and reduced incarceration for non-violent offenders—have drawn criticism from residents who feel that repeat property criminals are cycled back onto the streets too quickly. This approach, while intended to reduce jail overcrowding, has led to frustration in neighborhoods like Scranton’s Hill Section and Green Ridge, where property crime is a recurring nuisance. In contrast, suburbs such as Clarks Summit and Dunmore report significantly lower crime rates, with residents describing a small-town feel where neighbors watch out for one another. The borough of Old Forge, known for its tight-knit community, also maintains a lower crime profile, though it is not immune to the regional property crime trend.
The county’s judicial and prosecutorial environment is a key factor for anyone considering relocation. The current District Attorney, Mark Powell, has been in office since 2012 and has maintained a moderate-to-progressive stance on certain offenses, particularly those tied to addiction. Critics argue that this leniency has emboldened property criminals, especially in Scranton and the more densely populated boroughs like Taylor and Moosic. For families and retirees, the safest bets are the smaller townships: South Abington Township and Newton Township consistently report the lowest crime rates in the county, with violent crime nearly non-existent and property crime well below the county average.
Neighborhood-level variation is stark. In Scranton, the western wards near the University of Scranton see more petty crime and theft, while the northern reaches of the city near the Lackawanna River are quieter. Outside the city, the county’s rural areas—such as Dalton and Fleetville—offer a level of safety comparable to the safest small towns in Pennsylvania. Prospective residents should weigh the trade-offs: urban convenience and walkability in Scranton come with a higher risk of property crime, while the suburbs and townships provide a quieter, safer environment at the cost of longer commutes and fewer amenities.
* Values derived from national, state, county, city and local statistics and may differ in a specific area. Last updated: 2026-10-03T23:41:37.000Z
Narrative content on this page is AI-generated and may contain mistakes. Verify any details that matter before acting on them.
ReloMaps may earn a commission from affiliate links at no extra cost to you.

