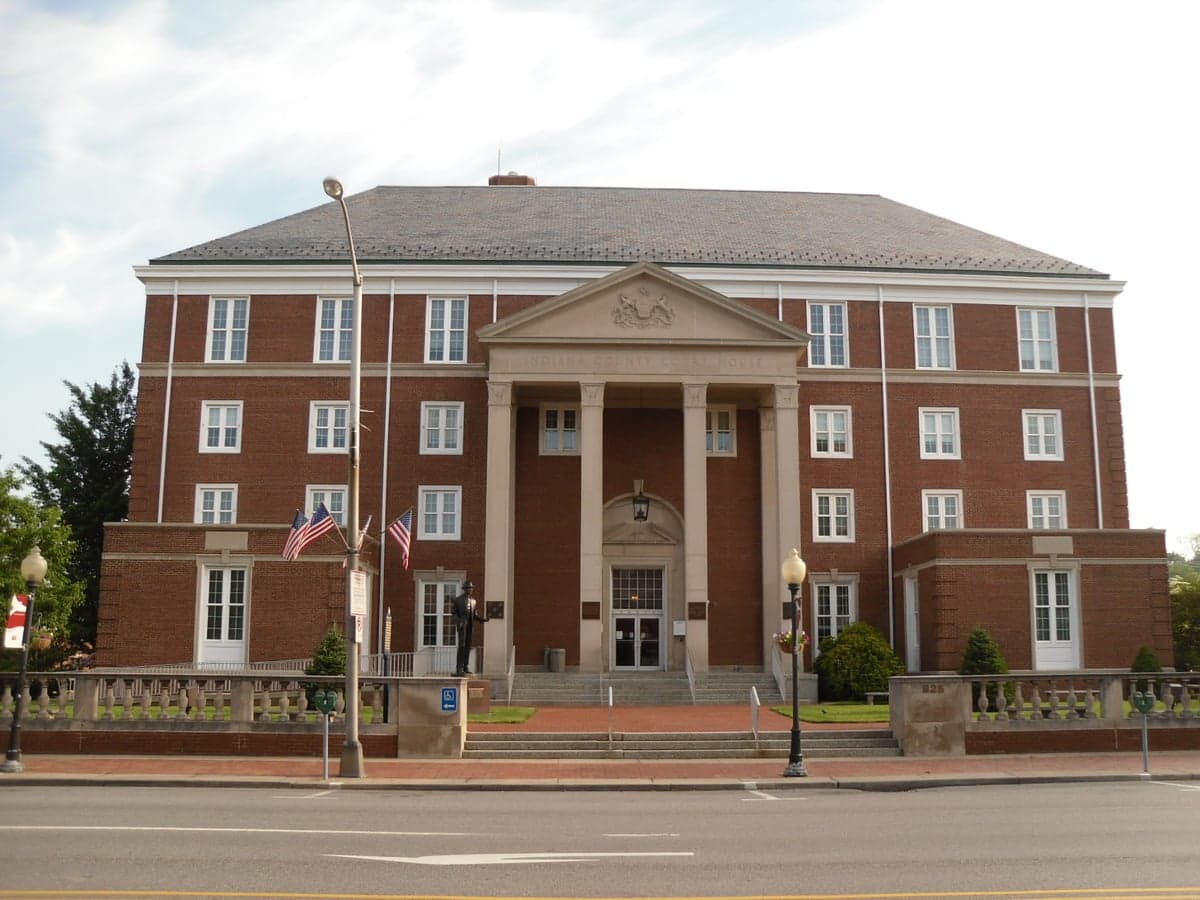
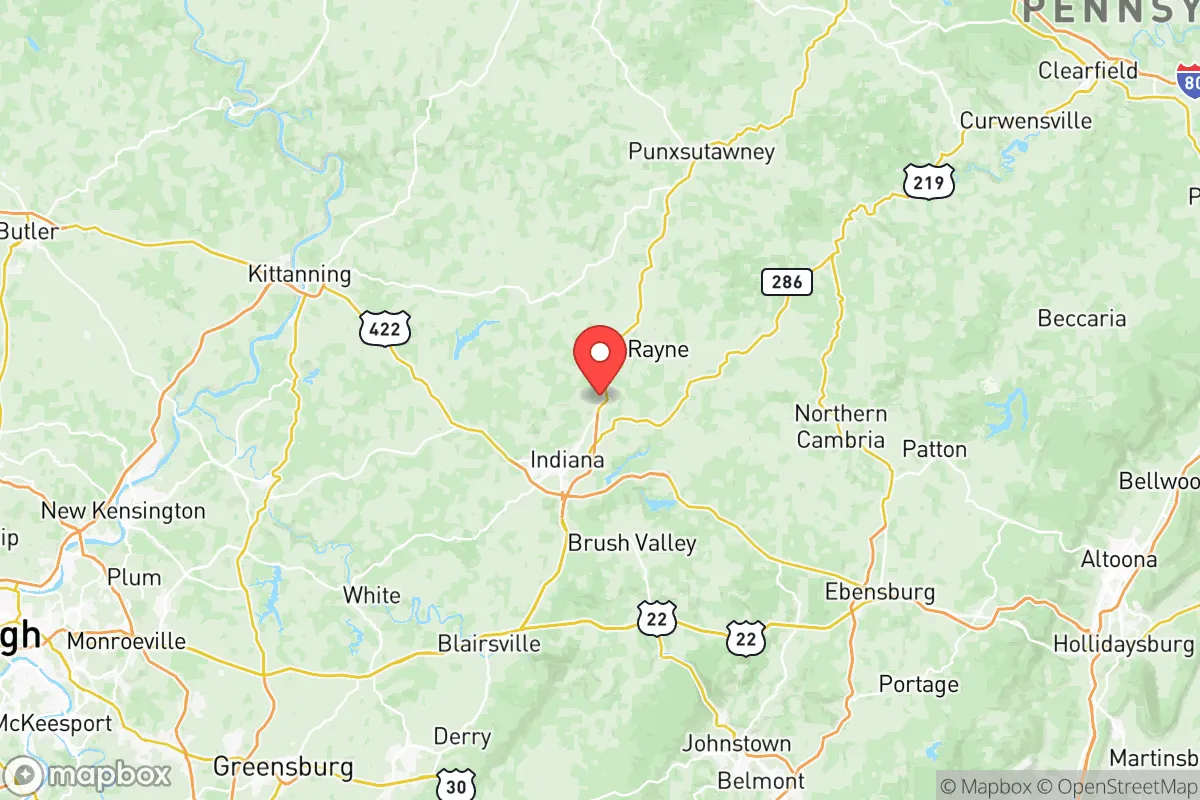
Photo: Wikipedia
Demographics of Indiana County
Affluence Level in Indiana County
A below-average socioeconomic profile. Incomes, home values, and educational attainment trail the U.S., with higher poverty and unemployment.
People of Indiana County
The people of Indiana County, Pennsylvania today number 83,213, forming a predominantly white (91.9%) and native-born (98.6% U.S.-born) population that is notably less diverse than the state or national average. With a college attainment rate of 26.9%, the county sits slightly below the Pennsylvania average, and its character remains rooted in small-town Appalachian and Rust Belt traditions, centered around the borough of Indiana (the county seat) and a network of historic mining and farming towns. The county's identity is shaped by its legacy as a coal and railroad hub, its role as home to Indiana University of Pennsylvania (IUP), and a population that has remained remarkably stable in size and composition over the past half-century.
Settlement & growth (pre-1960)
Before European settlement, the area now known as Indiana County was part of the hunting and trading grounds of the Iroquois Confederacy, particularly the Seneca and Lenape peoples, who used the region's river valleys—the Conemaugh, Blacklick, and Yellow Creek—for seasonal travel and resource gathering. The first European incursion came during the French and Indian War (1754–1763), when French forces built Fort Duquesne to the west, but permanent settlement did not begin until after the American Revolution.
The county was officially formed in 1803 from parts of Westmoreland and Clearfield counties, named for the "Indiana" territory of the time. The earliest white settlers were predominantly Scots-Irish and German farmers who moved west from the older settlements of Lancaster and York counties, following the Great Wagon Road and the Forbes Road. They established homesteads in the fertile valleys around Indiana Borough (founded 1805), Blairsville (settled 1780s), and Homer City (laid out 1854). These groups were largely Presbyterian and Lutheran, and their agricultural economy centered on grain, livestock, and timber.
The county's population exploded in the late 19th and early 20th centuries with the discovery of high-quality bituminous coal seams and the arrival of the Pennsylvania Railroad. From 1850 to 1920, the population surged from roughly 18,000 to over 80,000, driven by massive immigration from Southern and Eastern Europe. Italian, Polish, Slovak, Hungarian, and Lithuanian laborers poured into the county to work the deep mines. They settled in company towns and mining patches such as Lucernemines, Hillsdale, Brush Valley, and Rochester Mills, as well as the larger boroughs of Indiana and Blairsville. These immigrant communities built Catholic and Orthodox churches, ethnic social clubs, and fraternal organizations that still dot the landscape today. By 1910, roughly one-third of the county's population was foreign-born, a peak that would never be reached again.
The coal industry also drew a smaller number of African American workers from the South during the Great Migration (roughly 1910–1940), though their numbers remained modest compared to the industrial cities of Pittsburgh and Philadelphia. Black communities concentrated in Indiana Borough and Blairsville, where they worked in mines and on the railroad. The county's black population peaked at around 3.5% in 1930 before declining in later decades.
After World War II, the coal industry entered a long decline due to mechanization, competition from oil and natural gas, and the shift away from steam locomotives. The county's population peaked at 92,061 in 1950 and then began a slow, steady contraction. The construction of the Pennsylvania Turnpike (completed through the county in 1951) and the expansion of IUP (which became a university in 1965) provided some economic stabilization, but the era of mass immigration was over.
Modern era (post-1965)
The 1965 Hart-Cellar Act, which abolished national-origin quotas and opened immigration from Asia, Africa, and Latin America, had a minimal impact on Indiana County. Unlike major metropolitan areas, the county did not experience a wave of new immigrant settlement. The foreign-born population today stands at just 1.4%, far below the Pennsylvania average of 7.2% and the national average of 13.7%. This reflects the county's lack of large urban job centers, its distance from international airports, and the absence of established ethnic enclaves that might attract chain migration.
The most notable demographic shift since 1965 has been domestic out-migration of young adults. Many graduates of IUP leave the county for job opportunities in Pittsburgh (50 miles southwest), Philadelphia, or out of state. The county's population has declined from 92,061 in 1950 to 83,213 in 2020, a loss of roughly 10%. The population is also aging: the median age is 40.5, slightly above the state median, and the share of residents over 65 has grown to 19%.
Racial and ethnic diversity has increased modestly but remains low. The Hispanic population has grown from less than 0.5% in 1990 to 1.8% today, concentrated in Indiana Borough and White Township, where service-sector jobs in retail and hospitality are more available. The Black population has held steady at 2.3%, with the largest concentration in Indiana Borough (where it is roughly 5% of the borough's population). East/Southeast Asian residents (0.4%) and Indian-subcontinent residents (0.4%) are almost entirely associated with IUP—faculty, graduate students, and their families—and live primarily in Indiana Borough and the surrounding White Township suburbs.
Suburbanization has been limited. Unlike fast-growing Sun Belt counties, Indiana County has seen little new housing development outside the existing boroughs. The most growth has occurred in White Township, which surrounds Indiana Borough and has absorbed most of the county's new retail and residential construction since 1980. The township now has about 16,000 residents, making it the largest municipality by population. Meanwhile, many of the old coal patch towns—Lucernemines, Hillsdale, Rochester Mills—have seen their populations shrink by half or more since 1950.
The future
Indiana County's population is projected to continue a slow decline over the next 10–20 years, with the state forecasting a loss of roughly 3–5% by 2040. The county will likely become slightly more diverse but will remain overwhelmingly white and native-born. The Hispanic share may rise to 3–4% as families move in for lower housing costs and jobs in healthcare, education, and warehousing (the county has seen some logistics center growth along the U.S. Route 22 corridor). The East/Southeast Asian and Indian populations will likely remain small and tied to IUP, fluctuating with enrollment cycles.
The most significant demographic trend is aging in place. The county's young adults will continue to leave for urban job markets, while older residents—many of them descendants of the original Scots-Irish, German, and Eastern European settlers—remain. This will put pressure on local services, particularly healthcare and senior housing, and may accelerate the consolidation of school districts and municipal governments.
Culturally, Indiana County is likely to retain its conservative-leaning, family-oriented, and community-focused character. The county voted for Donald Trump by a 2-to-1 margin in 2020, and its political and social values reflect its Appalachian and Rust Belt roots. New residents—whether retirees from Pittsburgh, remote workers seeking affordable housing, or immigrants—will find a place where local identity is strong, change is gradual, and the past is still very much present in the names of towns, the churches on Main Street, and the accents of its people.
For someone moving in now, Indiana County offers a stable, low-cost, and safe environment with a strong sense of place—but it is not a place of rapid growth or demographic transformation. The county is becoming older, slightly more diverse, and slowly smaller, while holding onto the cultural and historical threads that have defined it for over two centuries.

* Values derived from national, state, county, city and local statistics and may differ in a specific area. Last updated: 2026-07-06T10:59:51.000Z
Narrative content on this page is AI-generated and may contain mistakes. Verify any details that matter before acting on them.
ReloMaps may earn a commission from affiliate links at no extra cost to you.

