Photo: Wikipedia
Quality of Life in NYC, NY
A livable area that tracks near national norms for affordability, walkability, and neighborhood health.
What does Quality of Life tell us?
Quality of Life blends cost of living, nearby amenities, socioeconomic signals, and neighborhood character. City-level scores represent the whole municipality; individual neighborhoods can differ.
What does this tell us?
Quality of Life blends cost of living, nearby amenities, socioeconomic signals, and neighborhood character. City-level scores represent the whole municipality; individual neighborhoods can differ.
Cost of Living
98% above national average
The Real Cost of Living in NYC, NY for 2026
| Tier | Individual | Family (4) |
|---|---|---|
| Survival | $28k | $53k |
| Comfortable | $138k | $202k |
| Luxury | $144k+ | $223k+ |
| Elite (Top 5%) | $237k+ | $368k+ |
39%
The Area Signal
A metric tracking the socioeconomic signals of the area.
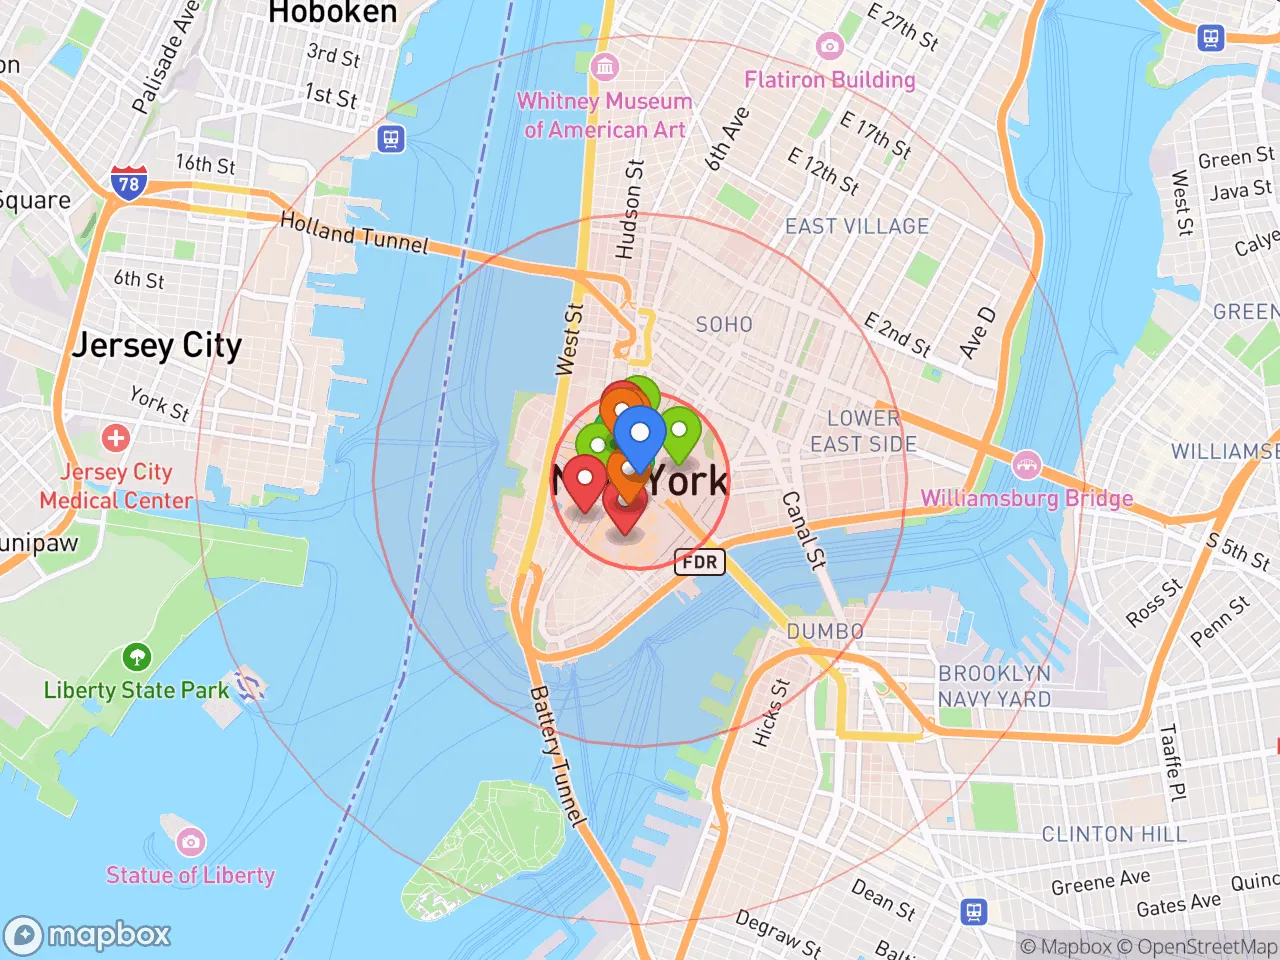
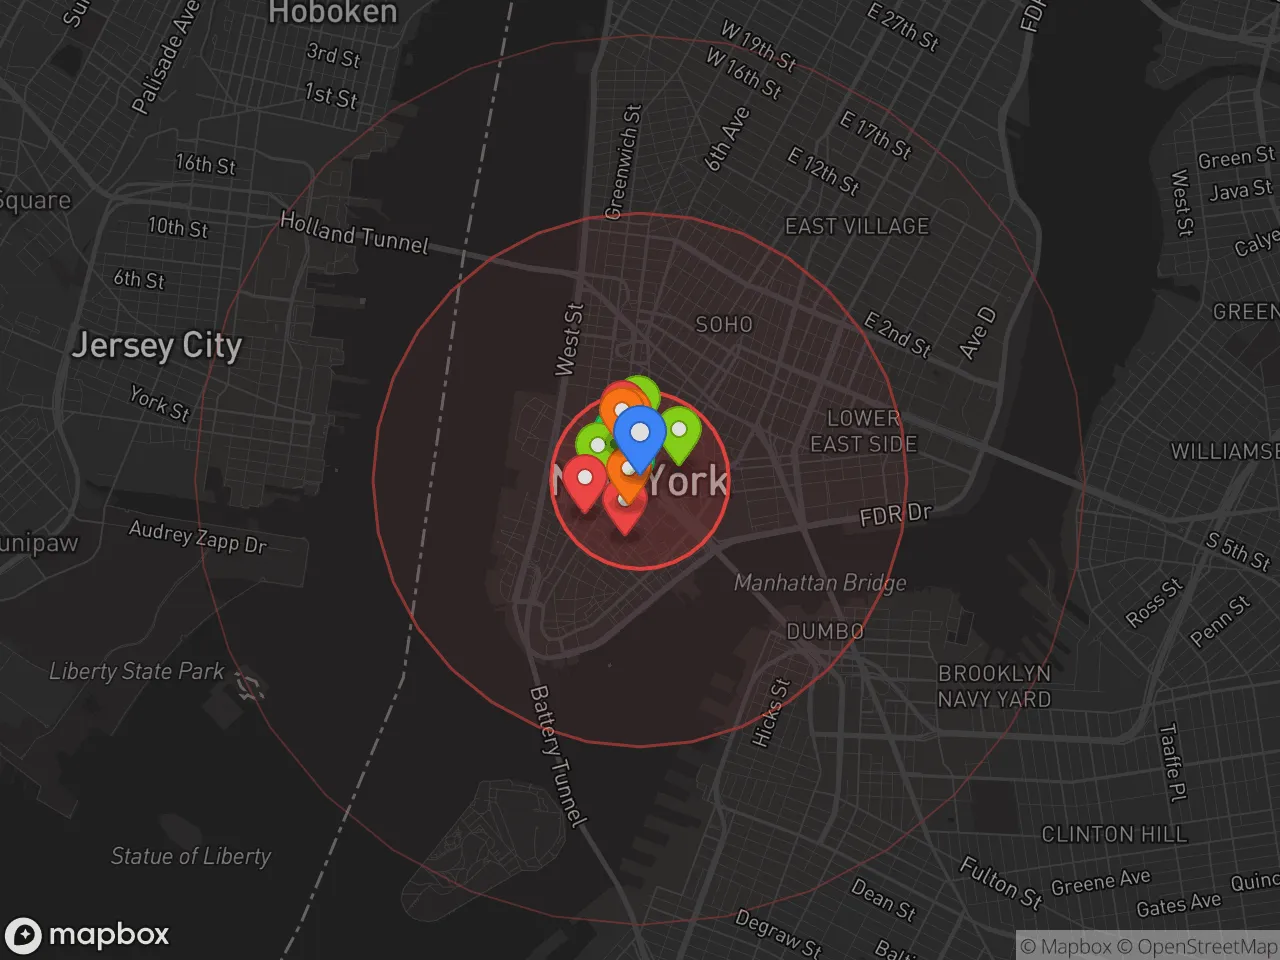
Hobbies
Explore the areaGroceries
0 within 10 miles
Gas
0 within 10 miles
Hospital
0 within 20 miles
Airport
EWR — Newark Liberty International
Post Office
Critical Amenities
Quality-of-Life Analysis
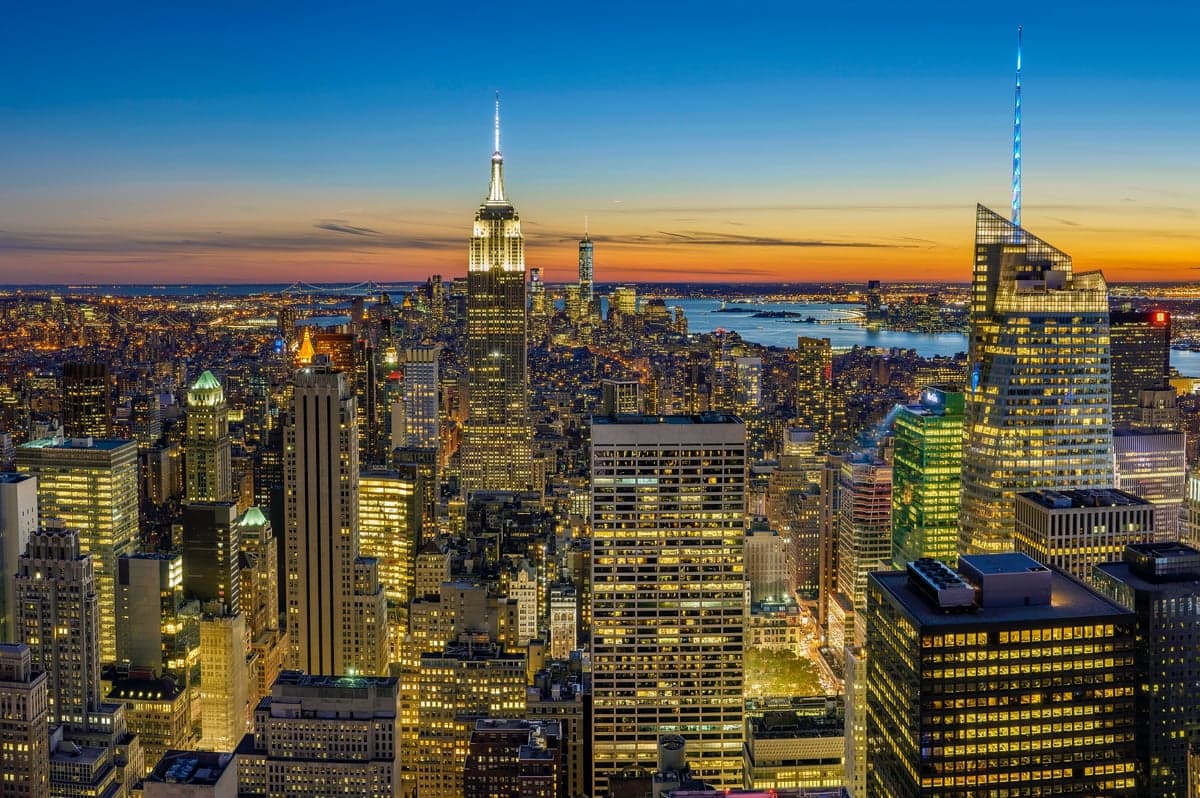
New York City presents a quality of life defined by extreme contrasts: it is one of the most affluent and expensive urban centers in the United States, yet it houses a vast economic spectrum from billionaires to service workers. The city's 8.5 million residents are a dense mosaic of professionals in finance, tech, media, and the arts, alongside immigrants, students, and long-standing working-class families. This concentration of ambition and diversity creates an unmatched energy, but the cost of that energy is a relentless financial and logistical pressure that shapes daily existence for nearly everyone.
Cost of living, housing affordability, and how NYC compares to nearby suburbs
New York City’s cost of living index sits at 198—nearly double the national average—making it the most expensive major city in the U.S. The primary driver is housing: the median home value is $751,700, though in Manhattan that figure exceeds $1.2 million, while more affordable outer-borough neighborhoods in Queens or the Bronx can still command $500,000–$600,000. Median rent across the five boroughs is $1,779, but this figure masks a brutal reality: a one-bedroom in a desirable Manhattan neighborhood often rents for $3,500–$4,500, and even in Brooklyn’s popular areas, $2,500 is common. Compared to nearby suburbs like Westchester County or northern New Jersey, NYC offers smaller living spaces for a higher price per square foot, though those suburbs trade urban convenience for larger homes and lower density. The average commute of 40.6 minutes—one of the longest in the nation—reflects the trade-off many make: living farther out for slightly more space while enduring packed subways, buses, or commuter rails. For renters, the city’s rent stabilization laws provide some protection, but new arrivals often face market-rate leases that consume 40–50% of gross income.
Amenities, schools, and the daily rhythm of life in the five boroughs
Daily life in NYC is defined by 24/7 access to world-class amenities: over 1,700 parks (including Central Park and Prospect Park), 24-hour subway service on most lines, and a restaurant scene with more than 24,000 eateries. The city’s public school system, the largest in the U.S., serves 1.1 million students, with elite specialized high schools like Stuyvesant and Bronx Science requiring competitive entrance exams, while neighborhood zoned schools vary dramatically in quality. The daily rhythm is fast-paced and transactional—grocery shopping often means small bodegas or delivery apps, laundry is frequently outsourced, and social life revolves around bars, museums, and street festivals. For families, the trade-off is clear: children grow up with unparalleled cultural exposure (free museums, Broadway shows, diverse peer groups) but often in small apartments with limited outdoor space. The city’s density means noise, crowding, and occasional service disruptions are constants, but so is the convenience of having anything—from a 2 AM pizza slice to a specialist doctor—within a short walk or subway ride.
Who thrives in New York City? The city rewards those who prioritize career opportunity, cultural access, and social density over space, quiet, and affordability. It suits ambitious professionals in high-income fields (finance, law, tech) who can absorb the housing costs, as well as creatives and entrepreneurs willing to trade financial stability for proximity to industry networks. Families who succeed here often have strong incomes or rent-stabilized apartments, and they embrace the city’s public spaces and schools as a trade-off for suburban lawns. Those who struggle are typically middle-income earners without housing protections, or anyone seeking a slower, car-dependent lifestyle. In short, New York City offers an unmatched urban experience—but only for those who can afford its price, tolerate its pace, and accept its compromises.

Crime in NYC, NY
WARNING: The crime statistics are unreliable for this jurisdiction. Local authorities have either not reported or under reported their data to the FBI. This could be due to bad intentions, incompetence or technical issues. Regardless, we suggest skepticism.
Higher crime rates than 65% of comparable U.S. locations.
Violent CrimeViolent Crime Analysis
Property CrimeProperty Crime Analysis
Crime Analysis
New York City's overall safety picture is a study in contrasts: while its violent crime rate of 363.5 per 100,000 residents is notably lower than many other large U.S. metros, the city's property crime rate of 1,547.4 per 100,000 sits above the national average. The city remains a relatively safe destination for tourists and residents in many core neighborhoods, but persistent property crime and a justice system shaped by progressive policies create real concerns for daily life and long-term safety.
Crime in context
Compared to the national violent crime rate of roughly 380 per 100,000, NYC's 363.5 figure is slightly below average, a significant improvement from the 1990s. However, the property crime rate of 1,547.4 per 100,000 is well above the national average of approximately 1,950 per 100,000, meaning property offenses like larceny and auto theft are a routine risk. The city's crime statistics are heavily influenced by the policies of progressive district attorneys in all five boroughs, who have implemented bail reform, declined to prosecute certain low-level offenses, and emphasized diversion programs. While intended to reduce incarceration, these policies have been linked to a rise in recidivism and a perception that consequences for property crime are minimal, emboldening repeat offenders.
What residents experience
For New Yorkers, the most tangible safety issue is the prevalence of property crime. Package theft from lobbies, bicycle theft, and car break-ins are common complaints, particularly in neighborhoods like the Upper West Side, Williamsburg, and Astoria. Subway crime, while statistically low per rider, remains a high-visibility concern due to high-profile assaults and fare evasion. The city's progressive justice approach means that many arrested for theft or low-level drug offenses are released without bail, often returning to the same blocks to re-offend. This cycle creates a sense of impunity that frustrates residents and small business owners who feel the system prioritizes offender rehabilitation over public safety and victim restitution.
Neighborhood-level variation
Safety varies dramatically by borough and block. Manhattan's Midtown and Financial District are heavily policed and generally safe, though property crime is constant. In contrast, parts of the Bronx (e.g., Hunts Point, Morrisania) and Brooklyn (e.g., Brownsville, East New York) experience violent crime rates two to three times the city average. Gentrifying areas like Bushwick and Ridgewood see a mix of rising property crime and occasional violent incidents linked to gang activity. Suburban commuter hubs like Long Island City and Downtown Brooklyn have lower violent crime but high rates of car theft and package theft. Prospective residents should research precinct-level crime maps and consider that the city's progressive judicial climate means even "safe" neighborhoods are not immune to the effects of a lenient criminal justice system.
* Values derived from national, state, county, city and local statistics and may differ in a specific area. Last updated: 2026-09-29T17:18:47.000Z
Narrative content on this page is AI-generated and may contain mistakes. Verify any details that matter before acting on them.
ReloMaps may earn a commission from affiliate links at no extra cost to you.

