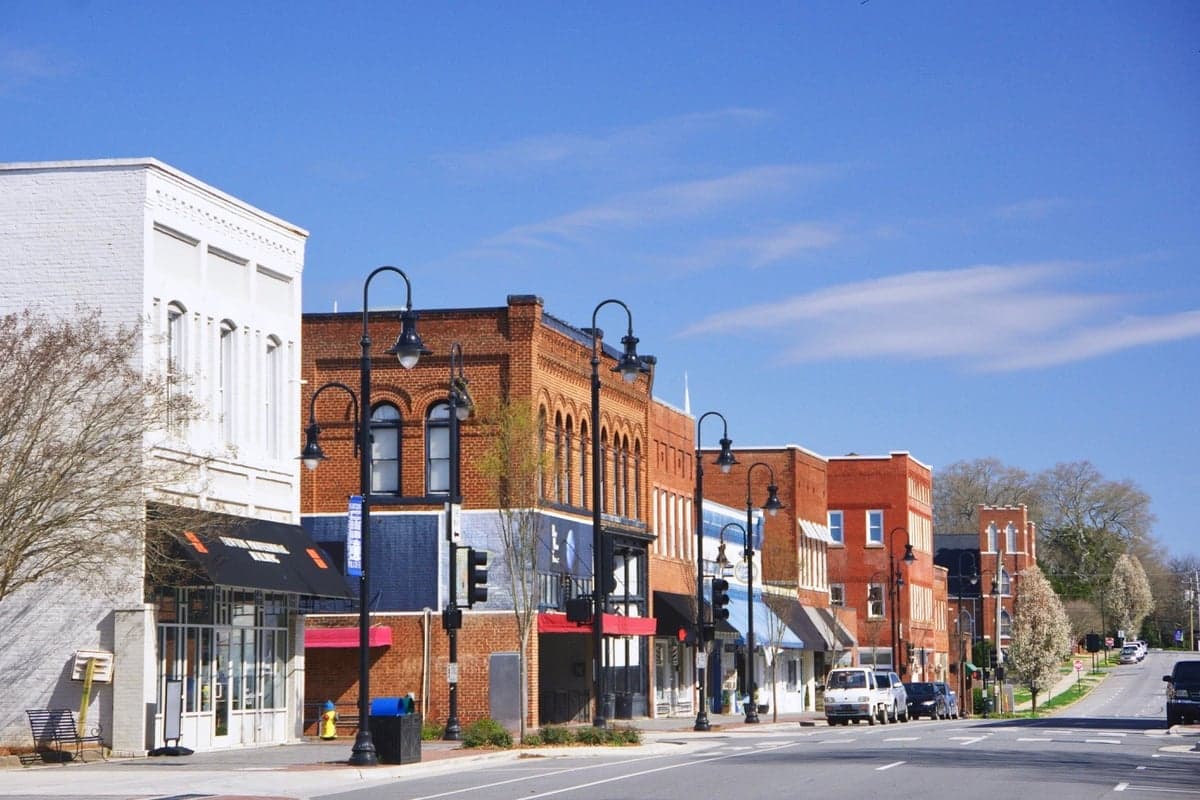
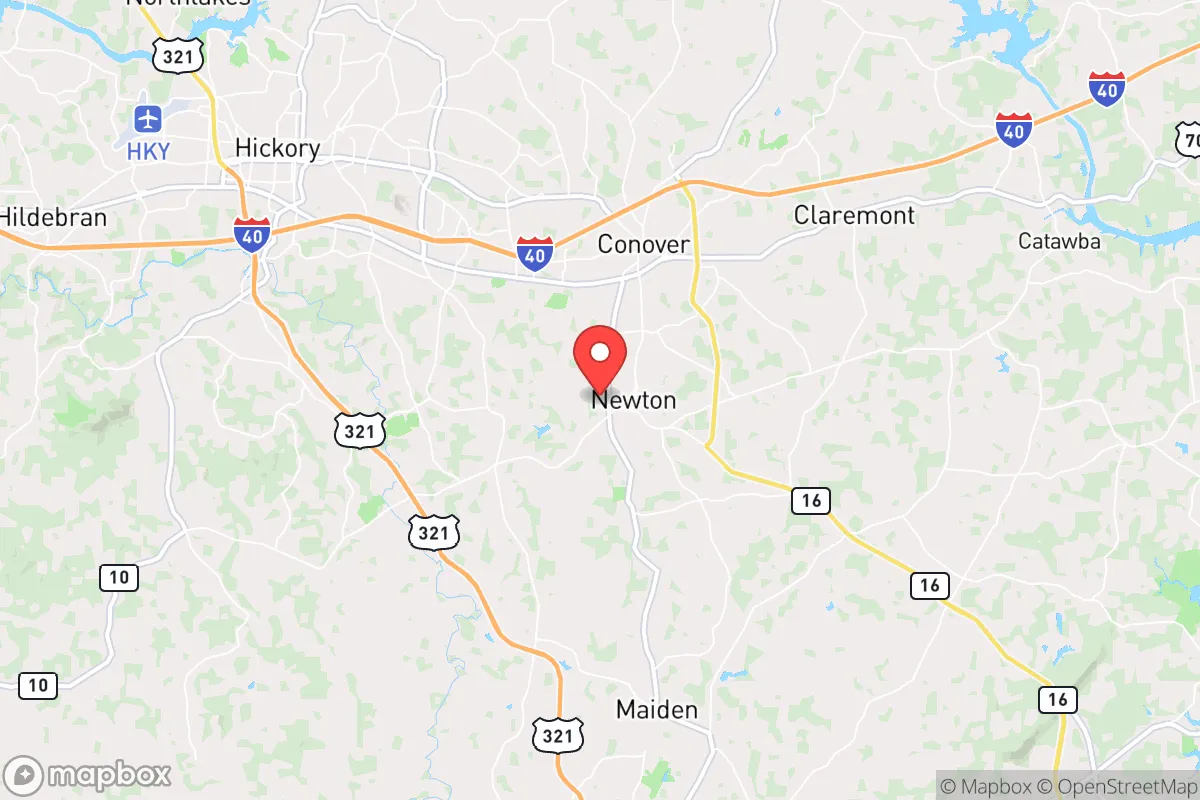
Photo: Wikipedia
Demographics of Newton, NC
Affluence Level in Newton, NC
A below-average socioeconomic profile. Incomes, home values, and educational attainment trail the U.S., with higher poverty and unemployment.
People of Newton, NC
The people of Newton, North Carolina, today number 13,223 and form a community that is notably more diverse than its rural Catawba County surroundings, yet retains a distinctly Southern, small-town character. With a population that is 62.2% White, 13.4% Hispanic, 11.3% Black, and 5.9% East/Southeast Asian, Newton is a working-class city where furniture and textile manufacturing roots still shape daily life. The city’s identity is marked by a strong sense of local pride, a slower pace of life, and a demographic profile that is becoming more diverse, particularly through Hispanic and Asian in-migration, even as the overall population remains modest in size.
How the city was settled and grew
Newton was founded in 1844 as the county seat of Catawba County, a position it won through a land grant and a central location. The original population was almost entirely of English, Scots-Irish, and German descent, drawn by the promise of fertile farmland in the Piedmont region. These early settlers built the core of what is now the Downtown Historic District, centered around the Catawba County Courthouse, where the first merchants, lawyers, and craftsmen established their businesses. The arrival of the Western North Carolina Railroad in the 1860s transformed Newton from an agricultural hub into a manufacturing center. By the early 1900s, the city’s economy was dominated by furniture factories and cotton mills, which drew a wave of rural White workers from the surrounding Appalachian foothills. These workers settled in neighborhoods like South Newton and West Newton, where modest mill houses and company-built cottages still stand. A smaller but significant Black population also grew during this period, concentrated in the East Newton area, where African American families built their own churches, schools, and businesses in the face of Jim Crow segregation. By 1950, Newton’s population was nearly all White and Black, with a small number of families tracing their roots to the original 19th-century settlers.
Modern era (post-1965)
The post-1965 era brought the first major demographic shifts to Newton. The Immigration and Nationality Act of 1965 opened the door for new arrivals, but it was the expansion of the furniture and textile industries in the 1970s and 1980s that drew the first significant Hispanic and Asian populations. Hispanic workers, primarily from Mexico and Central America, began arriving to fill labor shortages in local factories and construction. They initially settled in the Southwest Newton area, near the industrial parks, and later established a growing presence in North Newton, where affordable housing and proximity to jobs made the neighborhood attractive. Today, the Hispanic community makes up 13.4% of the population, a share that has steadily increased over the past two decades. The East/Southeast Asian community, now 5.9% of the population, arrived in a distinct wave starting in the 1990s, driven by the expansion of manufacturing and logistics in the broader Hickory-Lenoir-Morganton metropolitan area. Many of these families, of Vietnamese and Korean descent, settled in the Northeast Newton area, near the newer subdivisions and along the Highway 10 corridor. The Black population, which had been stable for decades, has seen a slight decline in relative share to 11.3%, as younger families have moved to larger cities like Charlotte or Hickory for more opportunities. The White population, now 62.2%, remains the largest group but has become more dispersed across the city, with older residents concentrated in the historic core and younger families moving to newer developments on the outskirts.
The future
Newton’s population is becoming more diverse, but the pace of change is moderate. The Hispanic and East/Southeast Asian shares are expected to continue growing, driven by family reunification and the area’s relatively low cost of living compared to Charlotte, which is about 45 minutes south. The White population is likely to decline slightly as older residents age out and younger White families continue to move to larger suburban areas. The city’s foreign-born population, currently 6.0%, is a key driver of this diversification. Newer arrivals are dispersing across the city rather than concentrating in a single neighborhood, though North Newton and Southwest Newton are seeing the most visible growth in Hispanic and Asian-owned businesses and community institutions. The college-educated share, at 19.3%, is low compared to state and national averages, which suggests that Newton will remain a working-class community for the foreseeable future. The cultural identity of the city is evolving from a historically White and Black Southern town into a more multi-ethnic, blue-collar community, where the annual Oktoberfest and the local Hispanic grocery store both feel like part of the same fabric.
For someone moving in now, Newton offers a stable, affordable, and increasingly diverse small city where the cost of living is low and the pace of life is unhurried. The demographic trends point toward a community that is slowly becoming more varied in its ethnic makeup, but that retains a strong sense of local tradition and a manufacturing-based economy. It is a place where newcomers, particularly those from Hispanic and Asian backgrounds, are finding a foothold, while long-time residents continue to shape the city’s character around family, faith, and work.

* Values derived from national, state, county, city and local statistics and may differ in a specific area. Last updated: 2026-09-28T20:36:42.000Z
Narrative content on this page is AI-generated and may contain mistakes. Verify any details that matter before acting on them.
ReloMaps may earn a commission from affiliate links at no extra cost to you.

