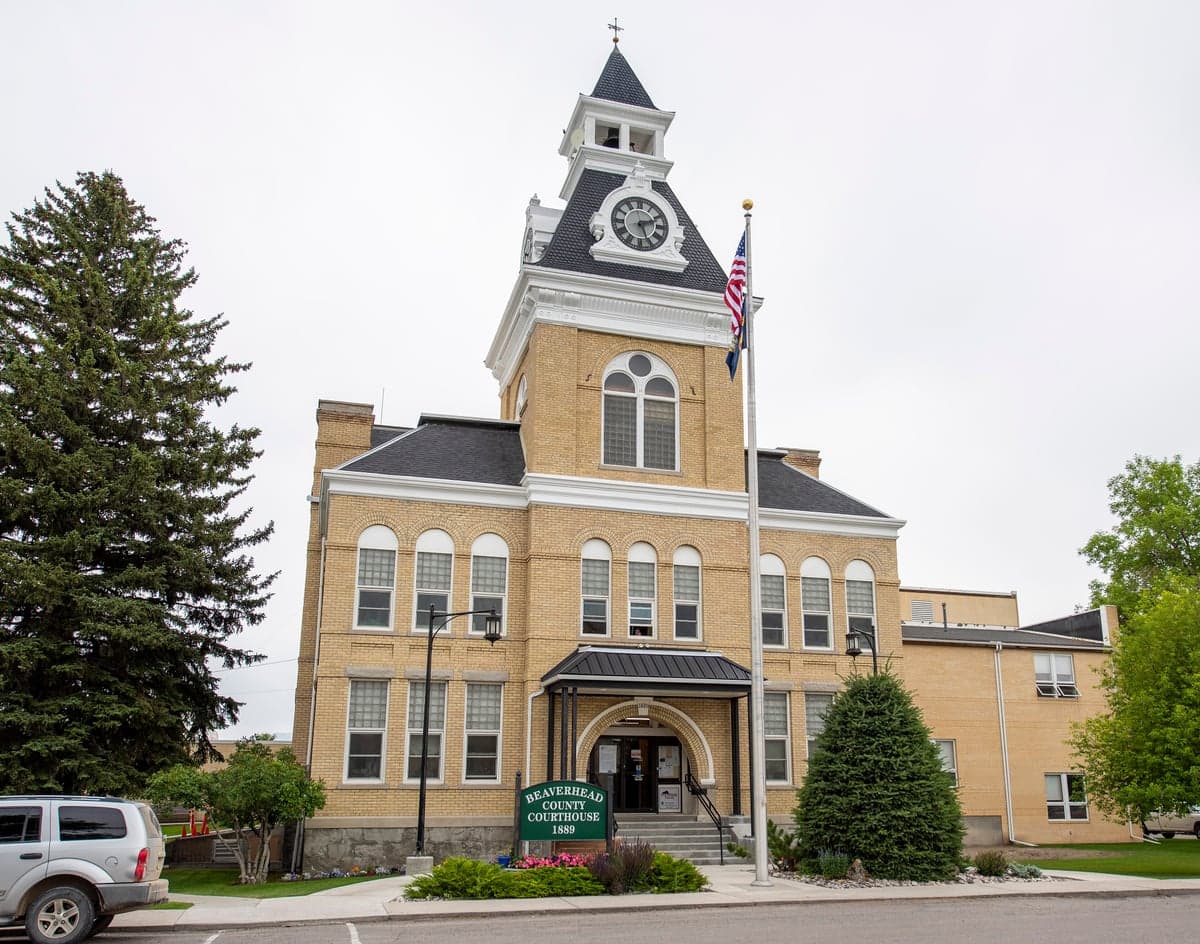
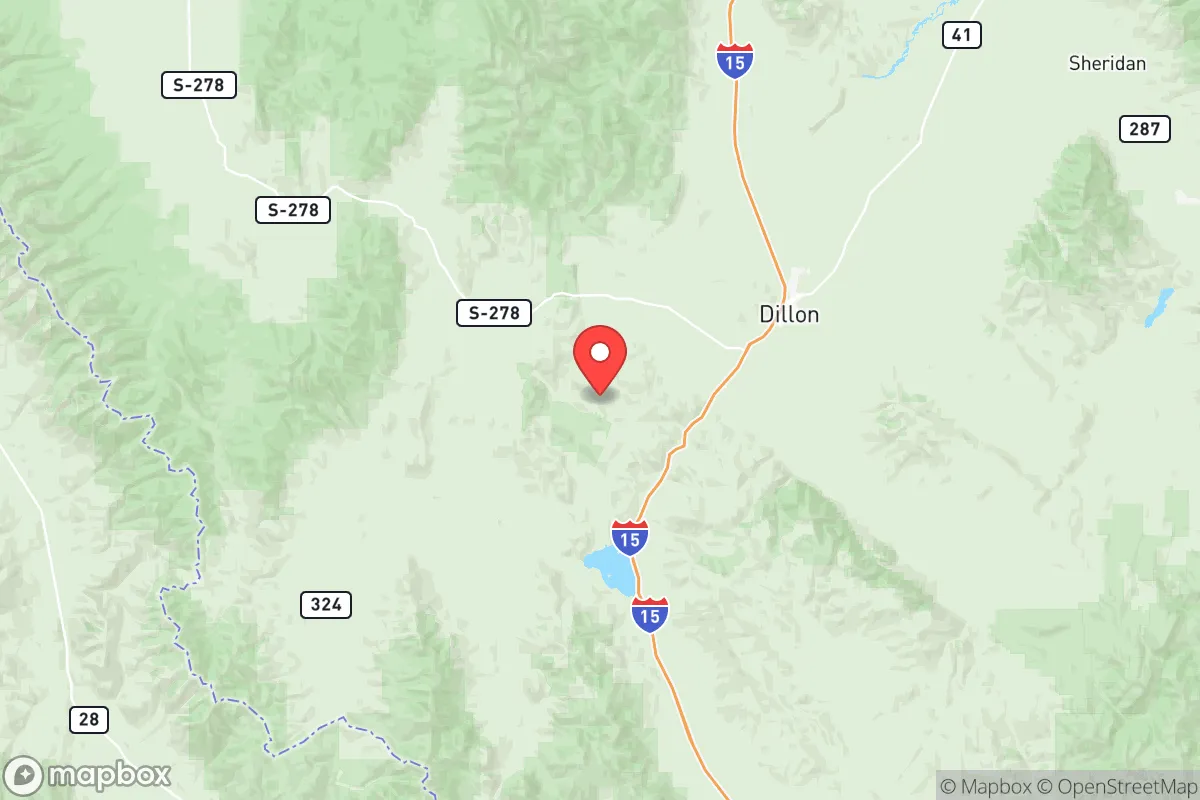
Photo: Wikipedia
Political ClimatePolitical Climate in Beaverhead County
Showing district-level results — no local-only data available.
Local Political AnalysisPolitical Analysis of Beaverhead County
Beaverhead County, Montana, is a reliably conservative area that has been trending further right in recent cycles, though it remains noticeably less Republican than the state as a whole. With a Cook Partisan Voting Index (PVI) of R+5, the county votes about five points more Republican than the national average, but that’s a full five points less Republican than Montana’s statewide R+10 rating. The shift has been steady: in 2020, Donald Trump won the county with 63% of the vote, up from 60% in 2016, while statewide he hit 57% in 2020. The trajectory is toward deeper red, but the county’s small, dispersed population—roughly 9,500 people—keeps local politics more personal and less polarized than in Montana’s booming urban centers like Bozeman or Missoula.
How it compares
The gap between Beaverhead County and Montana’s statewide lean is driven by a few key factors. The county’s largest town, Dillon, home to the University of Montana Western, introduces a modest liberal counterweight—precincts around campus and the historic downtown often vote 5-10 points more Democratic than the county average. In contrast, outlying communities like Lima and Wisdom are deep red, with precincts routinely hitting 75-80% Republican in presidential races. The swing precincts are in the rural subdivisions around Dillon, where ranching families and university staff mix; these areas can flip between 55-60% Republican depending on the candidate. Statewide, Montana’s R+10 reflects a broad rural-urban divide, with liberal strongholds like Missoula and Bozeman offset by vast, deeply conservative ranch counties. Beaverhead sits in the middle—conservative, but with enough institutional and demographic variety to keep it from being as uniformly red as, say, neighboring Madison County (R+15).
What this means for residents
For conservative residents, the county’s lean means their values are reflected in local governance—the county commission is all-Republican, and school board elections in Dillon rarely see contested races. Property taxes remain low, and there’s strong support for Second Amendment rights and limited land-use regulation. For liberal residents, the reality is more nuanced. They’re a clear minority, but not an isolated one; the university provides a social and political buffer, and statewide ballot initiatives—like the 2022 vote to legalize recreational marijuana, which passed countywide with 54%—show that even here, libertarian streaks can override party lines. The practical effect is that political conversations are more civil than in Bozeman, because everyone knows everyone. You can disagree with your neighbor at the county fair and still help them haul hay the next day.
Culturally, Beaverhead County stands apart from Montana’s fast-growing corridors. There’s no tech industry influx, no housing crisis driven by out-of-state buyers—yet. The biggest policy distinction is the county’s fierce independence from state mandates: during the 2020 pandemic, the commission openly defied Governor Steve Bullock’s stay-at-home orders, a move that solidified trust among conservatives and frustrated liberals. Looking ahead, the county will likely stay R+5 to R+7, as younger residents move to Dillon for the university and older retirees from California and Texas settle in the Beaverhead Valley, bringing their own brand of Western conservatism. It’s a place where politics is less about national culture wars and more about whether the county should fund a new road to the ski hill or keep the library open on Sundays.

State Political ClimatePolitical Climate in Montana
* Values derived from national, state, county, city and local statistics and may differ in a specific area. Last updated: 2026-06-22T06:02:32.000Z
Narrative content on this page is AI-generated and may contain mistakes. Verify any details that matter before acting on them.
ReloMaps may earn a commission from affiliate links at no extra cost to you.

