Photo: Wikipedia
Demographics of Mission, TX
Affluence Level in Mission, TX
A below-average socioeconomic profile. Incomes, home values, and educational attainment trail the U.S., with higher poverty and unemployment.
People of Mission, TX
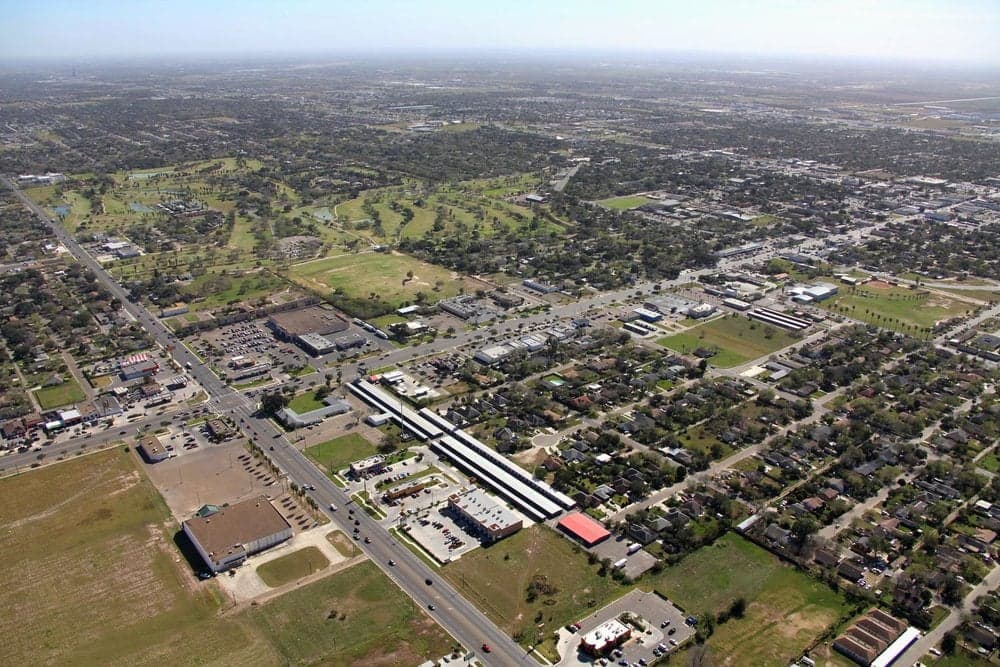
The people of Mission, Texas, today form a densely Hispanic community of 86,234 residents, where 88.2% identify as Hispanic or Latino and just 8.7% as non-Hispanic White. The city is overwhelmingly working- and middle-class, with a 29.0% college attainment rate, and its character is deeply shaped by generations of Mexican-American families alongside a smaller but growing mix of East/Southeast Asian (1.3%), Indian subcontinent (0.3%), and Black (0.9%) residents. Foreign-born residents make up 15.3% of the population, a share that reflects both long-standing cross-border ties and newer immigration patterns. Mission feels less like a typical American suburb and more like a bicultural border city where Spanish is heard as often as English, and where family networks and Catholic parish life anchor daily routines.
How the city was settled and grew
Mission was founded in 1908 as a planned agricultural colony by the American Rio Grande Land and Irrigation Company, which drained the floodplain and built irrigation canals to attract Midwestern farmers. The city was named for the historic La Lomita Mission, a small chapel built by Oblate priests in the 1860s that served as a way station for ranchers and traders. The original Anglo settlers—mostly farmers from Iowa, Kansas, and Nebraska—established the downtown Mission district around Conway Avenue and Doherty Avenue, building wood-frame houses and a commercial core that still retains some early-20th-century storefronts. By the 1920s, Mexican laborers were recruited to work the citrus and vegetable fields, and they settled in what became the La Lomita neighborhood south of the railroad tracks, a historically Mexican-American barrio that remains the city's most concentrated Hispanic enclave. The 1930s and 1940s brought Dust Bowl refugees from Oklahoma and Texas's Panhandle, who took up farming in the North Mission area near Mile 7 Road, while Mexican-American families continued to expand into West Side neighborhoods around Bryan Road. By 1950, Mission's population had reached roughly 5,000, split roughly evenly between Anglo farmers and Mexican-American laborers, though segregation kept the two groups in separate residential zones.
Modern era (post-1965)
The 1965 Hart-Celler Act ended national-origin quotas and opened immigration from Latin America and Asia, but Mission's modern demographic shift was driven less by new foreign arrivals and more by the internal migration of Mexican-American families from the Rio Grande Valley's rural colonias into the city proper. Between 1970 and 2000, Mission's population quadrupled from roughly 10,000 to over 45,000, with nearly all growth coming from Hispanic families moving out of unincorporated colonias like Las Milpas and into established city neighborhoods. The Sharyland area—named for the Shary family of citrus growers—became the primary destination for upwardly mobile Mexican-American families in the 1980s and 1990s, offering newer tract homes and better schools. Meanwhile, the Palm View neighborhood near the intersection of Expressway 83 and Conway Avenue absorbed many working-class families from the colonias, creating a dense, largely Spanish-dominant corridor. The non-Hispanic White share of the population fell from roughly 40% in 1970 to 8.7% today, as Anglo families aged in place or moved to retirement communities in Alamo and McAllen. The East/Southeast Asian community, though small at 1.3%, has concentrated in the Sharyland Plantation master-planned development, drawn by its highly rated Sharyland ISD schools and newer housing stock. The Indian subcontinent population (0.3%) is dispersed but slightly more visible near the medical district around Doctors Hospital at Renaissance. The Black population (0.9%) remains very small and is scattered across the city, with no single neighborhood majority.
The future
Mission's population is projected to continue growing steadily, reaching roughly 100,000 by 2035, driven by natural increase among the young Hispanic majority and continued in-migration from other parts of the Rio Grande Valley. The city is becoming slightly more diverse at the margins: the East/Southeast Asian share is expected to grow to 2-3% as medical professionals and small-business owners are drawn to the Sharyland Plantation corridor, while the Indian subcontinent share may reach 0.5-0.7% as the healthcare sector expands. The non-Hispanic White share will likely continue to decline slowly, falling below 7% by 2030, as older Anglo residents pass away and few new White families move in. The most significant demographic trend is the internal dispersal of Hispanic families from older barrios like La Lomita into newer subdivisions in the North Mission and East Mission areas, where home construction is booming along Mile 7 Road and Inspiration Road. This movement is gradually reducing the concentration of poverty in the historic West Side and creating a more geographically integrated, though still overwhelmingly Hispanic, city. Culturally, Mission is becoming less of a bilingual border town and more of a solidly Spanish-dominant community, with English increasingly reserved for school and business while Spanish remains the language of home and neighborhood.
For someone moving in now, Mission is a city where the population is young, family-oriented, and deeply rooted in Mexican-American culture, with a small but growing Asian and Indian presence concentrated in the Sharyland school zone. The city's future is one of continued Hispanic majority growth, modest diversification at the edges, and a gradual shift of population from historic barrios to newer subdivisions on the northern and eastern fringes. New residents should expect a community where Spanish fluency is a practical advantage, where Catholic parish life and extended family networks shape social rhythms, and where the public schools—especially Sharyland ISD—are the primary draw for families seeking upward mobility.

* Values derived from national, state, county, city and local statistics and may differ in a specific area. Last updated: 2026-11-11T17:26:40.000Z
Narrative content on this page is AI-generated and may contain mistakes. Verify any details that matter before acting on them.
ReloMaps may earn a commission from affiliate links at no extra cost to you.

