Photo: Wikipedia
Demographics of Worcester County
Affluence Level in Worcester County
A middle-class area roughly in line with national averages across income, home values, education, and employment.
People of Worcester County
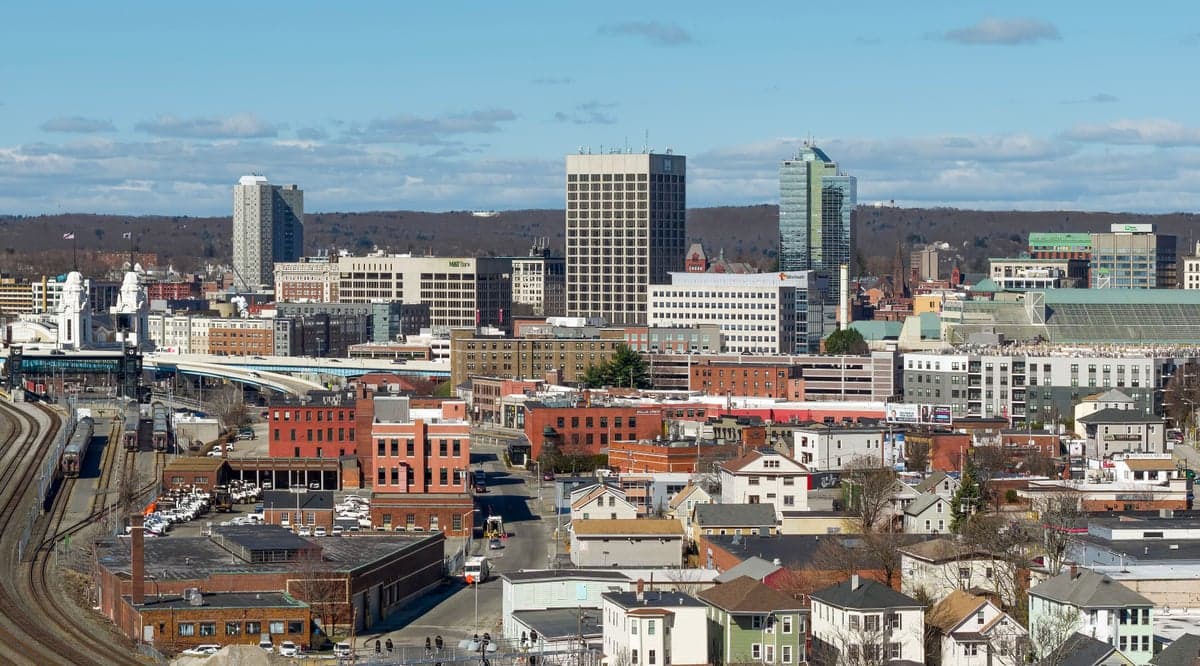
Worcester County’s 861,664 residents form a working-to-middle-class, predominantly white (71.8%) population that is notably more ethnically rooted and less transient than Greater Boston’s. The county’s identity is shaped by its historic role as a manufacturing and transportation corridor—a place where successive waves of European immigrants built mill towns and factory neighborhoods, and where today’s growing Hispanic (13.3%) and Asian (2.9% East/Southeast Asian, 2.3% Indian subcontinent) communities are reshaping smaller cities like Worcester, Fitchburg, and Leominster. With a foreign-born share of just 6.4%—well below the national average—Worcester County remains a region where generational family ties run deep, and where newcomers are still the exception rather than the rule.
Settlement & growth (pre-1960)
Long before European arrival, the Nipmuc people inhabited the lands of Worcester County, with seasonal villages along the Blackstone and Nashua Rivers. English colonists from the Massachusetts Bay Colony began pushing inland in the 1670s, establishing the town of Worcester in 1684 (permanently settled by 1713) and Lancaster in 1643. These early settlements were agricultural, but the county’s destiny shifted with the Industrial Revolution. The Blackstone River’s water power made Worcester a manufacturing hub by the 1820s, and the construction of the Blackstone Canal (1828) and later railroads turned the city into a rail center.
The first major immigrant wave was Irish, arriving in the 1840s and 1850s to dig canals and lay railroad track. They settled in Worcester’s “Island” neighborhood and in mill villages like Clinton and Southbridge. By 1870, the Irish made up roughly 20% of Worcester’s population. French-Canadians followed from the 1860s through the 1890s, drawn by textile mills in Fitchburg, Leominster, and Gardner. They established tight-knit parishes and French-language schools, and their descendants remain concentrated in those cities today. Swedes arrived in the 1870s and 1880s, working in Worcester’s wire and shoe factories, settling in the city’s Belmont Street corridor and in the town of Holden.
The turn of the 20th century brought Southern and Eastern Europeans. Italians came heavily between 1890 and 1920, settling in Worcester’s Shrewsbury Street neighborhood and in Milford, where they worked in granite quarries and shoe shops. Poles arrived in the same period, concentrating in Worcester’s Kelley Square area and in Webster, where they found work in the Stevens Linen Works. Lithuanians, Greeks, and Jews from Eastern Europe also formed distinct enclaves in Worcester and Fitchburg. By 1920, Worcester was one of the most ethnically diverse cities in New England, with over half its population foreign-born or of foreign parentage.
The Great Depression and World War II slowed immigration, but the postwar era brought a new domestic migration: African Americans from the South, part of the Second Great Migration, moved to Worcester and Southbridge for factory jobs. Their numbers remained small—Black residents made up just 2% of the county in 1960—but established communities that would grow in later decades. The 1950s also saw the first wave of suburbanization, as white ethnic families moved from Worcester’s triple-deckers to new developments in Auburn, Shrewsbury, and Westborough.
Modern era (post-1965)
The 1965 Hart-Cellar Act reshaped Worcester County’s demographics, though more gradually than in coastal Massachusetts. The first post-1965 arrivals were Puerto Ricans, who began migrating to Worcester in the 1970s for manufacturing jobs. They settled in the city’s Main South and Piedmont neighborhoods, and by 1990, Worcester’s Hispanic population had reached 10%. A second wave of Hispanic growth came from the Dominican Republic and Central America in the 1990s and 2000s, expanding into Fitchburg and Leominster. Today, the county’s 13.3% Hispanic population is concentrated in Worcester (where it approaches 25%), Fitchburg (over 30%), and Southbridge (over 40%).
Asian immigration arrived later and in smaller numbers. East and Southeast Asian communities—primarily Vietnamese, Chinese, and Korean—began settling in Worcester in the 1980s and 1990s, often as refugees or through family reunification. They established a small but visible presence in Worcester’s Grafton Street area and in Shrewsbury, which now has one of the highest Asian population shares in the county. Indian subcontinent immigrants, largely professionals in healthcare and technology, began arriving in the 1990s and accelerated after 2000. They concentrate in Westborough, Southborough, and Shrewsbury, drawn by the Route 9 and I-495 tech corridor. The county’s 2.3% Indian population is now slightly larger than its 2.9% East/Southeast Asian population, a reversal of the pattern in most Massachusetts counties.
Domestic migration since 1965 has been dominated by suburbanization and exurban sprawl. White ethnic families left Worcester and Fitchburg for towns like Holden, Paxton, and Rutland in the 1970s and 1980s, while higher-income professionals moved to Westborough, Northborough, and Harvard along the I-495 belt. The county’s Black population, still just 4.6%, grew modestly through domestic migration from Boston and other Northeastern cities, settling primarily in Worcester and Fitchburg. Since 2000, Worcester County has seen net domestic out-migration of non-Hispanic whites, offset by international immigration and higher birth rates among Hispanic and Asian families.
The future
Worcester County is becoming slowly more diverse, but it remains one of the least diverse counties in Massachusetts outside the Boston metro. The non-Hispanic white share, 71.8% in 2024, is projected to fall to roughly 65% by 2040, driven by aging demographics and continued Hispanic and Asian immigration. The Hispanic population is expected to grow fastest, particularly in Worcester, Fitchburg, and Southbridge, where it could approach majority status in some neighborhoods. East/Southeast Asian and Indian communities will likely continue to concentrate in the I-495 towns, with Shrewsbury and Westborough becoming increasingly Asian-majority suburbs.
Domestic migration patterns are shifting. Young professionals priced out of Boston are moving to Worcester and its inner suburbs, drawn by lower housing costs and commuter rail access. This influx is gradually raising the county’s college-educated share (currently 39.0%) and diversifying the political and cultural landscape. At the same time, older white residents are aging in place in rural towns like Barre, Hardwick, and Phillipston, where populations are flat or declining. The county’s overall growth rate is modest—about 0.3% annually—and is concentrated in the Worcester-Shrewsbury-Westborough corridor and along the Route 2 belt through Leominster and Fitchburg.
For someone moving in now, Worcester County offers a demographic middle ground: more diverse than the rural hill towns of Western Massachusetts, but far less diverse than Boston or Cambridge. The county’s cultural identity is evolving from its blue-collar, ethnic-European roots toward a more mixed, suburban-exurban character, with growing Hispanic and Asian communities adding new traditions, restaurants, and religious institutions. The next decade will likely see continued diversification in the urban core and inner suburbs, while the outer towns remain predominantly white and older.

* Values derived from national, state, county, city and local statistics and may differ in a specific area. Last updated: 2026-07-10T00:04:39.000Z
Narrative content on this page is AI-generated and may contain mistakes. Verify any details that matter before acting on them.
ReloMaps may earn a commission from affiliate links at no extra cost to you.

