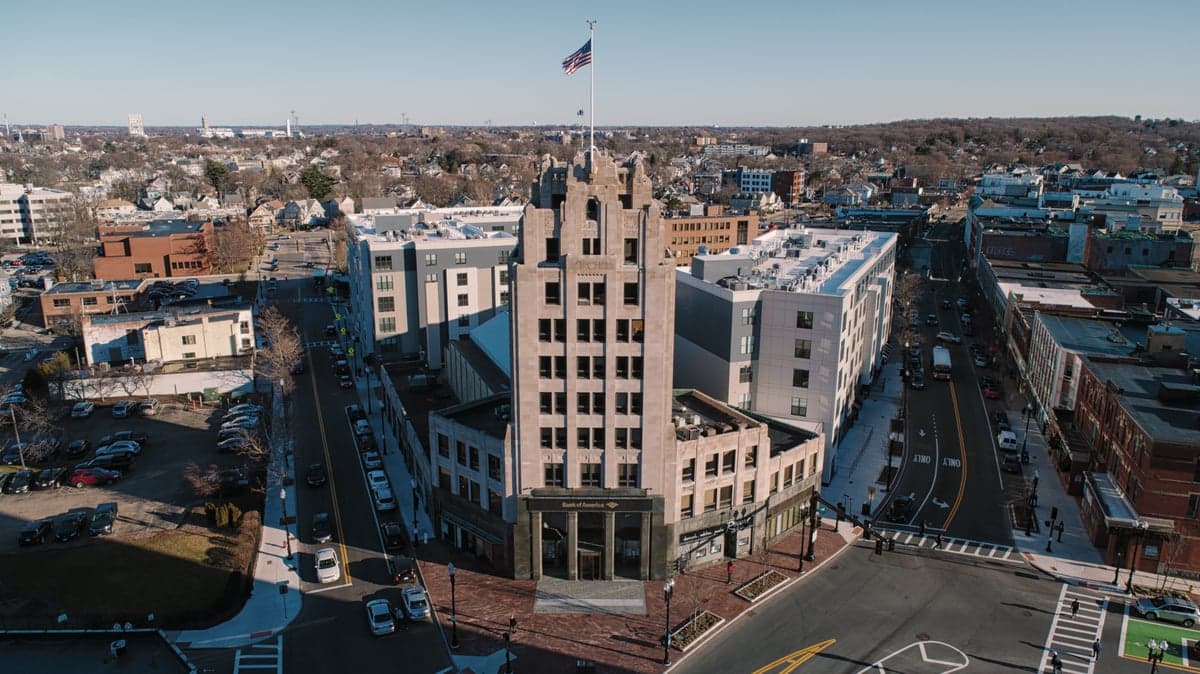
Photo: Wikipedia
Quality of Life in Norfolk County
A livable area that tracks near national norms for affordability, walkability, and neighborhood health.
What does Quality of Life tell us?
Quality of Life measures an area by evaluating factors like cost of living, nearby amenities, country club access, airport proximity, socioeconomic signals and neighborhood character. For large states, this is a general average — quality of life can vary dramatically between metro areas, suburbs, and rural communities within the same state.
What does this tell us?
Quality of Life measures an area by evaluating factors like cost of living, nearby amenities, country club access, airport proximity, socioeconomic signals and neighborhood character. For large states, this is a general average — quality of life can vary dramatically between metro areas, suburbs, and rural communities within the same state.
Cost of Living
99% above national average
68%
The Real Cost of Living in Norfolk County for 2026
| Tier | Individual | Family (4) |
|---|---|---|
| Survival | $33k | $62k |
| Comfortable | $126k | $185k |
| Luxury | $229k+ | $354k+ |
| Elite (Top 5%) | $295k+ | $457k+ |
Quality-of-Life Analysis
Norfolk County, Massachusetts, offers a broad spectrum of quality-of-life options, from dense, transit-oriented suburbs to quiet, semi-rural towns, drawing a diverse population of Boston commuters, families seeking top-ranked schools, and residents who prefer a slower pace. The county’s character shifts noticeably from its eastern edge, where the urban influence of Boston is strongest, to its western and southern reaches, where open space and smaller populations define daily life. With a cost-of-living index of 199—nearly double the national average—and a median home value of $649,400, the trade-offs between proximity to the city and space are starkly reflected in real estate and lifestyle choices.
Largest town(s) & population centers
The county’s largest population centers are Quincy, Brookline, and Newton, each offering a distinctly urban-suburban lifestyle. Quincy, the most populous city in the county, is a dense coastal hub with a robust public transit system—the Red Line terminates here—and a thriving Asian-American community centered around North Quincy and Wollaston. Daily life in Quincy is walkable in its core neighborhoods, with a median rent of $2,072 aligning closely with the county average, though home values in its waterfront areas can exceed $700,000. Brookline, an independent town completely surrounded by Boston, is a high-density, pedestrian-friendly enclave known for its exceptional public schools and proximity to Longwood Medical Area. Newton, a collection of 13 villages, offers a more suburban feel with large historic homes, excellent schools, and commuter rail access; its median home value often surpasses $1 million, placing it at the high end of the county’s cost spectrum. These towns attract professionals and families who prioritize short commutes—the county average is 32.9 minutes—and access to urban amenities while maintaining a strong sense of local community.
Smaller towns & rural pockets
Moving west and south, the county transitions into smaller towns with lower population densities and more open land. Medfield, Norfolk, and Millis are classic examples of semi-rural communities where single-family homes on acre lots are common, and town centers are compact. Medfield, with a population around 13,000, is known for its conservation land and highly rated school system, drawing families who accept a longer commute for space. Norfolk, bordering Bristol County, retains a distinctly rural character with active farms and the sprawling Norfolk Town Forest. Millis, the smallest town in the county by area, offers a quiet, family-oriented atmosphere with a historic downtown and access to the Charles River. Further south, Wrentham and Plainville are more affordable entry points into the county, with median home values closer to $500,000–$550,000, and are popular among those who want a rural feel without sacrificing proximity to the commuter rail or major highways like I-495.
Cost & lifestyle range
The cost of living in Norfolk County varies dramatically by location, creating a clear spectrum of lifestyle options. At the high end, Brookline and Newton command median home values well above $800,000, with property taxes reflecting premium school systems and municipal services; these towns offer walkable village centers, high-end dining, and direct subway or commuter rail access to downtown Boston. In the middle, towns like Dedham, Canton, and Walpole provide more moderate home prices—typically in the $550,000–$650,000 range—with a mix of older homes and new subdivisions, good schools, and a balance of suburban convenience and open space. At the lower end of the county’s cost spectrum, Stoughton and Randolph offer median home values closer to $450,000–$500,000, with more diverse populations and slightly longer average commutes; these towns are often chosen by first-time homebuyers and those seeking more square footage for their money. Renters face a countywide median of $2,072, but this varies from over $2,500 in Brookline to under $1,800 in more affordable towns like Avon or Holbrook.
Norfolk County’s range of options means that different residents can find a fit based on their priorities. Commuters who value transit access and urban energy gravitate toward Quincy, Brookline, or Newton. Families seeking top-tier schools and a traditional suburban setting often choose Medfield, Wellesley, or Needham. Those who want a quieter, more affordable lifestyle with land and a slower pace are drawn to Norfolk, Millis, or Wrentham. The county’s strength lies in this diversity, offering a viable choice for nearly any household willing to navigate its high overall cost of living in exchange for access to one of the nation’s strongest regional economies.

Crime in Norfolk County
Generally safer than 67% of comparable U.S. locations.
Violent CrimeViolent Crime Analysis
Property CrimeProperty Crime Analysis
Crime Analysis
Norfolk County, Massachusetts, presents a mixed safety profile that is heavily shaped by its proximity to Boston and the contrasting policies of its district attorneys. With a violent crime rate of 284.3 per 100,000 residents and a property crime rate of 993.9 per 100,000, the county sits below the national average for violent offenses but above the Massachusetts state average for property crime. However, these county-wide figures mask significant disparities between its affluent, suburban communities and its more urbanized, transit-connected towns, where progressive prosecutorial policies have raised concerns about public safety and recidivism.
Crime in context
Norfolk County’s violent crime rate of 284.3 per 100,000 is roughly 23% lower than the national average of approximately 370 per 100,000, but it is notably higher than the Massachusetts state average of about 260 per 100,000. The property crime rate of 993.9 per 100,000 is below the national average of 1,954 per 100,000 but exceeds the Massachusetts average of roughly 850 per 100,000. This indicates that while residents are less likely to face violent attacks than in many parts of the country, theft, burglary, and motor vehicle theft are more common here than in the rest of the state. The county’s crime index is heavily influenced by its larger, more densely populated communities such as Quincy, Brockton, and Weymouth, which report higher incident volumes than the smaller towns to the south and west.
What residents experience
Residents in Norfolk County’s suburban towns generally report feeling safe, but the experience varies dramatically by jurisdiction. In Brookline and Newton, violent crime is rare, with rates often below 100 per 100,000, and property crime is the primary concern, typically involving unlocked vehicles or package theft. In contrast, Brockton has struggled with a violent crime rate that can exceed 500 per 100,000, driven by gang activity and drug-related offenses. Quincy, the county’s largest city, sees moderate property crime but has experienced a rise in motor vehicle thefts and break-ins near the MBTA Red Line stations. The Norfolk County District Attorney’s Office, which covers all towns except Brookline (which falls under the Suffolk County DA), has faced criticism for policies that some residents believe prioritize diversion and rehabilitation over accountability. Critics argue that progressive approaches, including reduced bail recommendations and pre-trial diversion for repeat property offenders, have contributed to a revolving-door effect in communities like Stoughton and Randolph, where residents report seeing the same individuals committing thefts and break-ins after brief court appearances.
Neighborhood-level variation and judicial concerns
The safest neighborhoods in Norfolk County are concentrated in the western and southern towns. Medfield, Dover, and Walpole consistently report the lowest crime rates in the county, with violent crime often below 50 per 100,000 and property crime well under 500 per 100,000. These communities benefit from low population density, high property values, and well-funded local police departments. Conversely, the highest crime areas are clustered around Brockton’s downtown core and the transit-oriented neighborhoods of Quincy Center and East Weymouth, where easy access to Boston via commuter rail and subway brings both economic opportunity and transient criminal activity. Residents in these areas should be particularly vigilant about property crime, as the combination of high foot traffic and progressive prosecutorial policies in the Norfolk County DA’s office has led to a perception that property crimes are treated with leniency. For those considering a move to Norfolk County, the choice of town is critical: a family in Dedham may experience a very different safety reality than one in Braintree, even though they are only a few miles apart, due to differences in policing strategy, community engagement, and the local impact of district attorney policies.
* Values derived from national, state, county, city and local statistics and may differ in a specific area. Last updated: 2026-06-17T16:55:08.000Z
Narrative content on this page is AI-generated and may contain mistakes. Verify any details that matter before acting on them.
ReloMaps may earn a commission from affiliate links at no extra cost to you.

