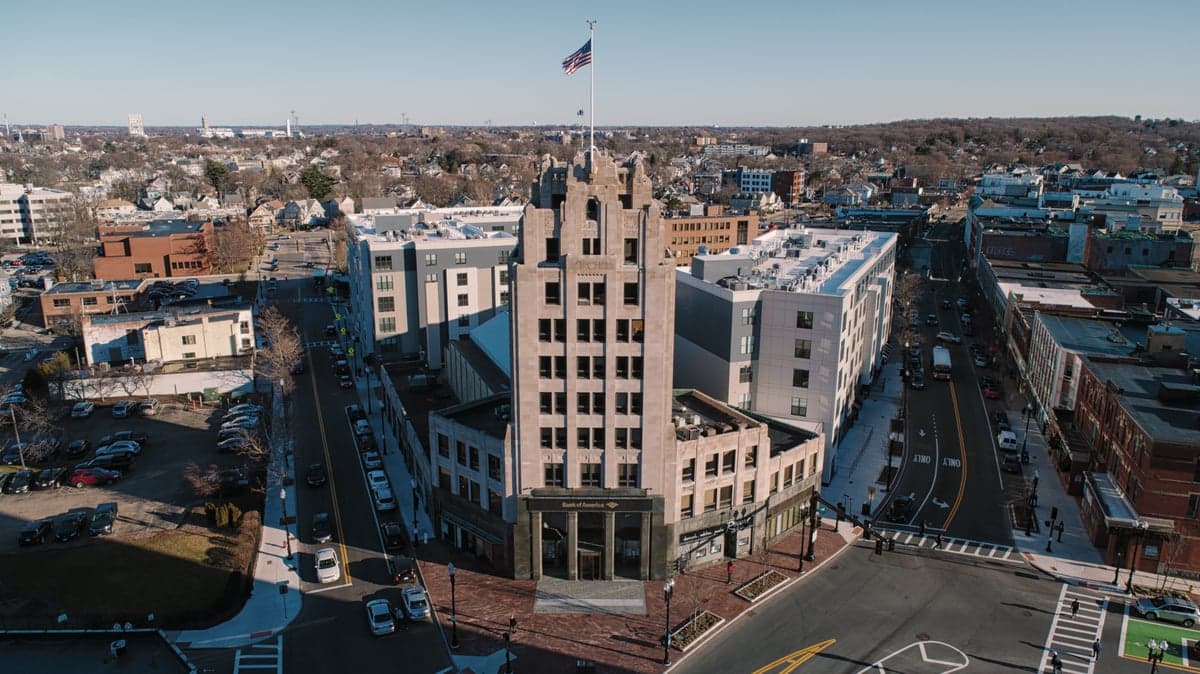
Photo: Wikipedia
Demographics of Norfolk County
Affluence Level in Norfolk County
An upper-middle-class area. Household wealth, education levels, and homeownership run ahead of national benchmarks.
People of Norfolk County
Today, the people of Norfolk County, Massachusetts form one of the most educated and economically stable populations in the United States, with 57.6% of adults holding a college degree and a median household income well above the national average. The county’s 724,540 residents are predominantly white (70.0%), but its suburban towns and small cities are increasingly diverse, shaped by decades of immigration and domestic migration. Distinctive identity markers include a strong civic attachment to historic New England town governance, a high concentration of healthcare and technology professionals, and a cultural character that blends Boston-adjacent urbanity with preserved rural and coastal landscapes.
Settlement & growth (pre-1960)
Long before European colonization, the area now known as Norfolk County was inhabited by the Massachusett and Wampanoag peoples, who lived along the Neponset River and the coastal lowlands. English Puritan settlers began arriving in the 1630s, establishing some of the oldest towns in Massachusetts. Dedham, founded in 1636, was the first permanent English settlement in what is now Norfolk County, followed by Weymouth (originally part of the Plymouth Colony) and Hingham. These early communities were agrarian, organized around Congregational churches, and governed by the town meeting system that persists today.
During the 18th and early 19th centuries, Norfolk County’s population grew slowly, dominated by English-descended Yankees. The Industrial Revolution brought a major shift. From the 1820s through the 1880s, Irish immigrants arrived in large numbers, fleeing the Great Famine and seeking work on the railroads, in textile mills, and as domestic laborers. They concentrated in industrializing towns such as Quincy, Braintree, and Randolph, where granite quarrying and shipbuilding provided steady employment. By 1900, Irish Americans formed the largest ethnic group in many Norfolk County communities, and their political and cultural influence remains visible today in local parishes, labor unions, and Democratic Party politics.
The late 19th and early 20th centuries brought additional waves. Italian immigrants settled heavily in Quincy and Milton from the 1890s through the 1920s, working in construction, stonecutting, and the emerging shoe industry. French Canadians crossed from Quebec into towns like Franklin and Wrentham, drawn by textile mills and boot factories. A smaller but notable population of Eastern European Jews arrived in the early 1900s, settling in Brookline and parts of Dedham, where they established synagogues and small businesses. These groups, combined with the older Yankee and Irish stock, gave Norfolk County a solidly white, Catholic-majority character by mid-century.
Suburbanization accelerated after World War II. Between 1950 and 1970, Norfolk County’s population surged as returning veterans and young families left Boston for new housing developments in towns like Norwood, Walpole, and Sharon. The construction of Route 128 (now I-95) and the Massachusetts Turnpike made commuting feasible, and the county’s population became increasingly professional and managerial. This period cemented Norfolk County’s reputation as a desirable, safe, and well-schooled suburban ring around Boston.
Modern era (post-1965)
The 1965 Hart-Cellar Act fundamentally altered Norfolk County’s demographic trajectory. Prior to 1965, the county was over 95% white. By 2026, the white share had fallen to 70.0%, driven by both immigration and domestic out-migration of white families to farther exurbs. The most significant post-1965 change has been the growth of East and Southeast Asian communities. Chinese, Taiwanese, and Korean immigrants began arriving in the 1970s and 1980s, drawn by the county’s top-ranked public schools and proximity to Boston’s technology and healthcare sectors. They concentrated in Brookline, Newton (which straddles Middlesex County but includes Norfolk County portions), and Sharon, where Asian students now make up a substantial share of public school enrollments. Today, East and Southeast Asian residents account for 9.3% of the county’s population.
Indian-subcontinent immigration accelerated after the 1990s, fueled by the H-1B visa program and growth in Boston’s biotech and software industries. Indian Americans now represent 2.8% of Norfolk County residents, with notable concentrations in Sharon, Westwood, and Franklin. These communities are among the most highly educated and affluent in the county, with many adults holding graduate degrees and working in STEM fields. Unlike some regions where Indian and East Asian populations cluster together, Norfolk County’s Indian communities have formed their own civic and religious institutions, including Hindu temples and cultural associations.
Black residents, who make up 6.9% of the population, include both long-established African American families and more recent immigrants from the Caribbean and Africa. Randolph and Brockton (the latter partially in Plymouth County) have historically been centers of Black settlement, with Randolph seeing significant growth of Haitian American families since the 1980s. Hispanic residents (5.5%) are a smaller but growing presence, with Puerto Rican and Dominican communities concentrated in Quincy and Randolph. Domestic migration has also reshaped the county: since 2010, a net outflow of Massachusetts residents to lower-cost states has been partially offset by an influx of young professionals from other parts of the Northeast and California, drawn by the county’s strong job market and high quality of life.
The future
Norfolk County is becoming more diverse, but at a slower pace than the nation as a whole. The white share of the population is projected to continue declining gradually, while East Asian, Indian, and Hispanic shares will increase. The county’s foreign-born population, currently 7.6%, is likely to rise as international immigration to the Boston region recovers from pandemic-era lows. New immigrant communities are dispersing more widely than earlier waves: rather than forming dense ethnic enclaves, Asian and Indian families are settling in towns across the county, drawn by school quality rather than co-ethnic proximity. This pattern is likely to continue, making Norfolk County’s suburbs more diverse but also more diffuse in their ethnic geography.
Housing costs will be the primary constraint on future population growth. Norfolk County’s median home price exceeds $700,000, pricing out many young families and lower-income households. This is likely to slow population growth and accelerate the county’s demographic shift toward higher-income, highly educated residents. The county’s cultural identity will remain rooted in its New England traditions — town meetings, historic preservation, strong public schools — but will increasingly reflect the influence of its Asian and Indian communities, who are already active in local politics and school boards. For someone moving in now, Norfolk County offers a stable, well-governed, and increasingly multicultural environment, but one where affordability is a real challenge and where the pace of change is measured rather than disruptive.
Norfolk County is becoming a denser, more diverse, and more expensive version of its postwar self — a place where historic Yankee and Irish Catholic roots coexist with thriving Asian and Indian communities, and where the biggest question for newcomers is not whether they will fit in, but whether they can afford to stay.

* Values derived from national, state, county, city and local statistics and may differ in a specific area. Last updated: 2026-06-17T16:55:08.000Z
Narrative content on this page is AI-generated and may contain mistakes. Verify any details that matter before acting on them.
ReloMaps may earn a commission from affiliate links at no extra cost to you.

