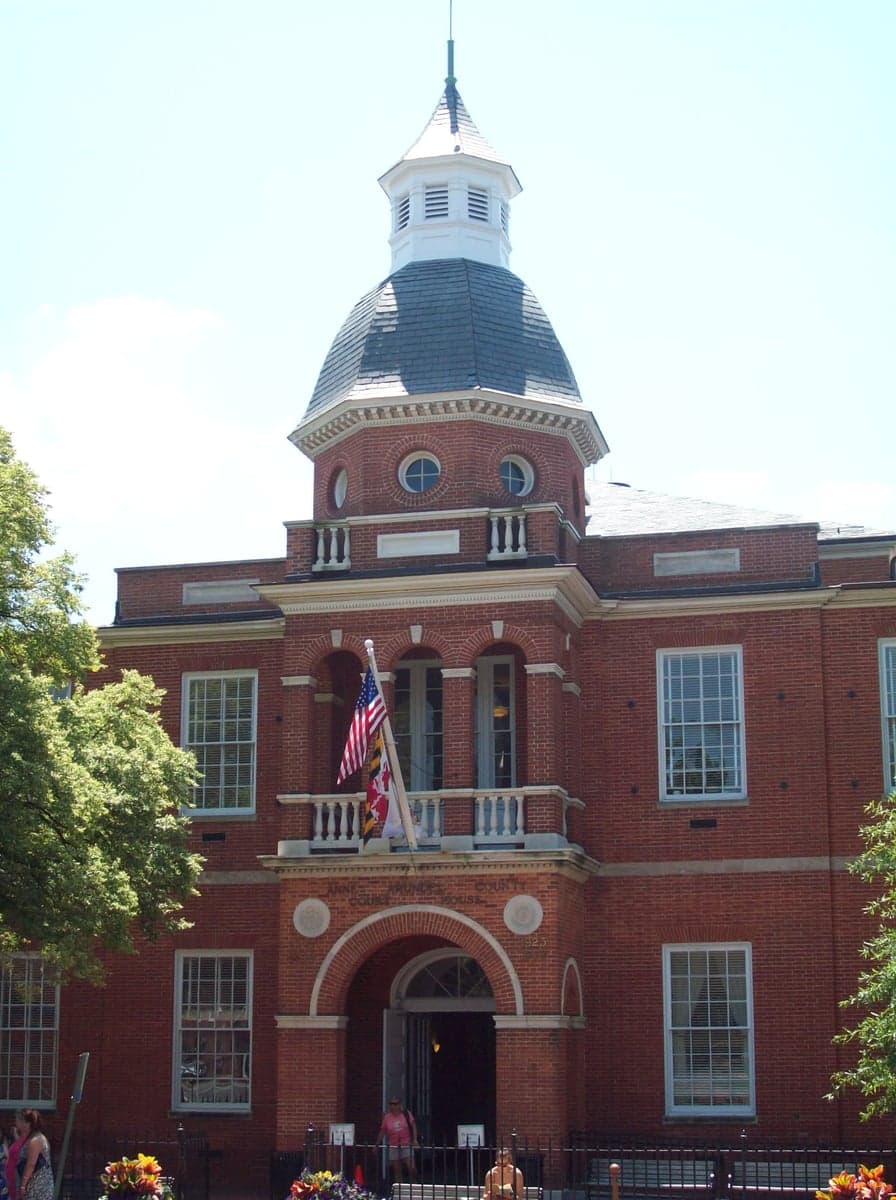
Photo: Wikipedia
Demographics of Anne Arundel County
Affluence Level in Anne Arundel County
An upper-middle-class area. Household wealth, education levels, and homeownership run ahead of national benchmarks.
People of Anne Arundel County
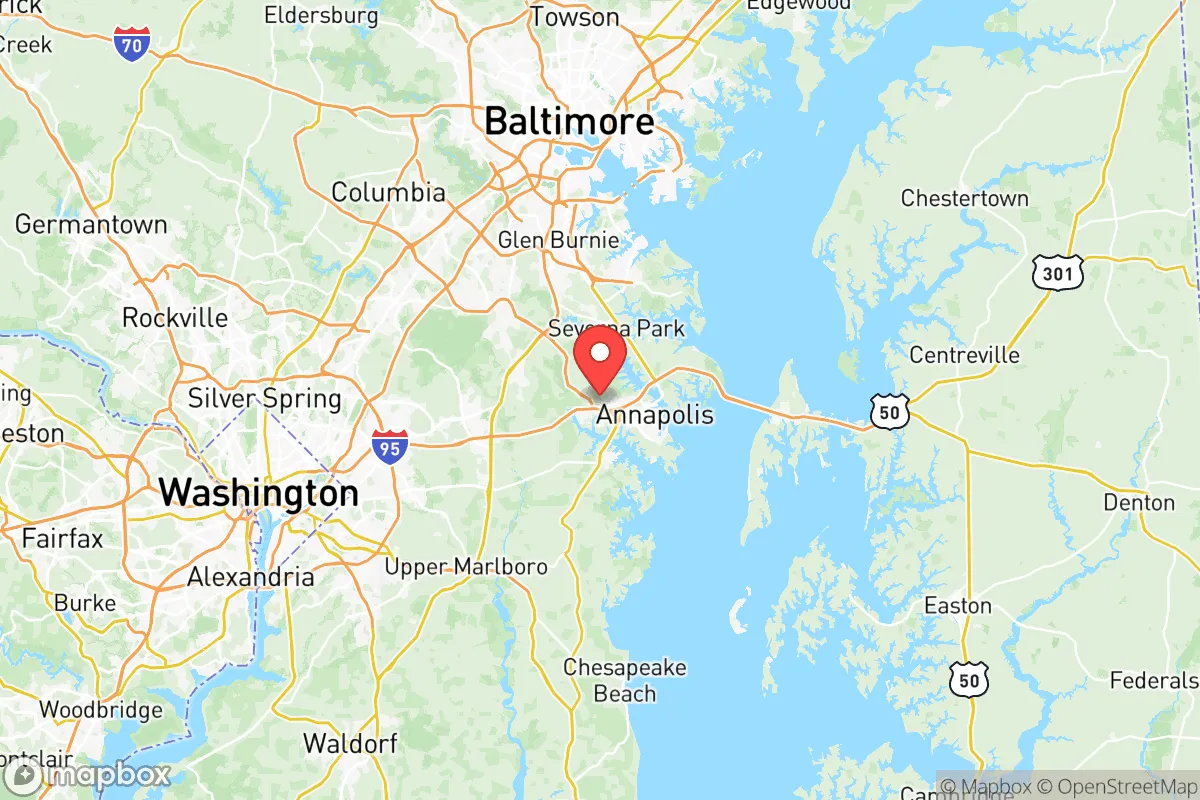
Anne Arundel County today is a densely populated, economically diverse region of 590,936 residents, anchored by the state capital of Annapolis and the Baltimore-Washington corridor. Its population is predominantly white (62.7%) with a significant Black minority (17.4%) and a growing Hispanic community (10.0%), while the foreign-born share remains low at 4.1%. The county’s identity is shaped by a mix of historic Chesapeake Bay waterfront communities, sprawling postwar suburbs, and a strong presence of federal government and defense contractors, giving it a character that is both rooted in colonial history and oriented toward modern professional employment.
Settlement & growth (pre-1960)
The first people to inhabit what is now Anne Arundel County were Algonquian-speaking tribes, primarily the Piscataway and the Susquehannock, who lived along the Chesapeake Bay and its tributaries. English colonists from the Province of Maryland began arriving in the 1630s, establishing tobacco plantations along the South River and the Severn River. The county was formally created in 1650, named after Lady Anne Arundell, the wife of Lord Baltimore. The colonial capital was moved from St. Mary’s City to Annapolis in 1694, cementing the city’s role as a political and commercial hub. During the 18th century, the population grew slowly, dominated by English gentry and their enslaved African labor force, with smaller numbers of Scots-Irish and German settlers arriving as indentured servants or small farmers in the western parts of the county.
After the American Revolution, Anne Arundel remained a rural, slave-based tobacco economy through the early 1800s. The county’s Black population, both enslaved and free, was substantial; by 1860, roughly 40% of the county’s residents were enslaved. The Civil War and emancipation dramatically reshaped the population. Many freed African Americans remained in the county, forming tight-knit communities in areas like Edgewater, Davidsonville, and Galesville, where they worked as watermen, farmers, and laborers. The late 19th and early 20th centuries saw slow growth, with the county remaining largely agricultural and maritime. The arrival of the Baltimore and Annapolis Railroad in the 1880s spurred some suburban development, but the population remained under 100,000 until World War II.
The single most transformative event for Anne Arundel’s population was the establishment of the U.S. Naval Academy in Annapolis in 1845, which brought a steady influx of military personnel and civilian support staff. However, the real boom came with World War II and the Cold War. The federal government built Fort George G. Meade in 1917, but its expansion during the 1940s and 1950s, along with the creation of the National Security Agency (NSA) in 1952, turned the county into a major defense and intelligence hub. This drew thousands of domestic migrants from across the United States—engineers, analysts, and military families—who settled in new suburbs like Glen Burnie, Severna Park, and Odenton. The 1950s and 1960s saw explosive growth, with the county’s population more than doubling from 103,000 in 1950 to 297,000 in 1970, driven almost entirely by white, middle-class families moving into tract housing developments.
Modern era (post-1965)
The 1965 Hart-Cellar Act had a relatively muted direct effect on Anne Arundel County compared to major gateway cities, because the county’s foreign-born population remains low at just 4.1%. However, the act’s indirect effects are visible. The most notable post-1965 immigrant group is East/Southeast Asian communities, who now make up 2.7% of the population. Many of these families arrived in the 1980s and 1990s as professionals in engineering and information technology, drawn by jobs at Fort Meade, the NSA, and defense contractors like Northrop Grumman. They settled in clusters around Hanover and Columbia (the latter technically in Howard County but adjacent to Anne Arundel), as well as in newer subdivisions near Crofton. The Indian subcontinent community, at 1.3%, followed a similar pattern, with many working in tech and medicine and concentrating in the same western corridor.
The most significant demographic shift since 1965 has been domestic, not international. The county’s Black population, which had been historically concentrated in rural enclaves and Annapolis’s older neighborhoods, began a slow suburbanization. The construction of the Baltimore-Washington Parkway and I-97 opened up areas like Millersville and Gambrills to Black middle-class families moving from Baltimore City and Washington, D.C. The Hispanic population, now 10.0%, grew rapidly after 2000, driven by both immigration and domestic migration. Hispanic residents, primarily of Central American and Mexican origin, have concentrated in Annapolis (particularly the Parole and Eastport neighborhoods) and in the Glen Burnie area, working in construction, landscaping, and hospitality. The county’s white population, while still the majority at 62.7%, has declined from over 80% in 1980, as the county has become more diverse through both natural increase and migration.
Suburbanization has continued to reshape the county. The 1990s and 2000s saw massive development in the western part of the county, along the I-97 and MD-32 corridors, with new communities like Waugh Chapel and Piney Orchard attracting families from across the region. The county’s college-educated population is now 45.2%, reflecting the high concentration of professional jobs tied to the federal government and defense sector. This has created a cultural divide between the older, more working-class waterfront communities and the newer, more affluent suburbs, but the overall trend is toward a highly educated, politically moderate population.
The future
Anne Arundel County is projected to become more diverse in the coming decades, though at a slower pace than the Washington, D.C., suburbs to its south. The Hispanic and East/Southeast Asian populations are expected to grow steadily, driven by both immigration and higher birth rates, while the white population will continue its gradual decline. The Indian subcontinent community, while small, is likely to grow as the tech and defense sectors expand. The county’s low foreign-born share (4.1%) suggests that future diversity will come more from domestic migration and natural increase than from new international arrivals.
The most significant demographic trend is the continued suburbanization of the county’s western half, particularly around Odenton and Fort Meade, where the federal government’s Base Realignment and Closure (BRAC) process in 2005 brought thousands of new jobs and families. This area is becoming a dense, mixed-use corridor, attracting younger, more diverse residents. In contrast, the eastern shore of the county, including Deale and Shady Side, remains older, whiter, and more rural, with a declining population as watermen and fishing communities shrink. The county’s cultural identity is likely to evolve from a historically white, military-oriented suburb into a more multiethnic, professional-class region, though it will remain less diverse than neighboring Prince George’s County or Baltimore City.
For someone moving in now, Anne Arundel County offers a stable, well-educated, and increasingly diverse environment with strong job prospects in defense and technology. The population is becoming more suburban and less tied to the Chesapeake Bay’s maritime heritage, but the county retains a distinct sense of place through its historic towns, waterfront communities, and the enduring presence of Annapolis as a political and cultural anchor. The next 10-20 years will likely see continued growth in the western corridor, a gradual diversification of the population, and a slow but steady shift away from the county’s historically white, military-dependent identity toward a more varied, professional-class character.

* Values derived from national, state, county, city and local statistics and may differ in a specific area. Last updated: 2026-07-10T08:39:25.000Z
Narrative content on this page is AI-generated and may contain mistakes. Verify any details that matter before acting on them.
ReloMaps may earn a commission from affiliate links at no extra cost to you.

