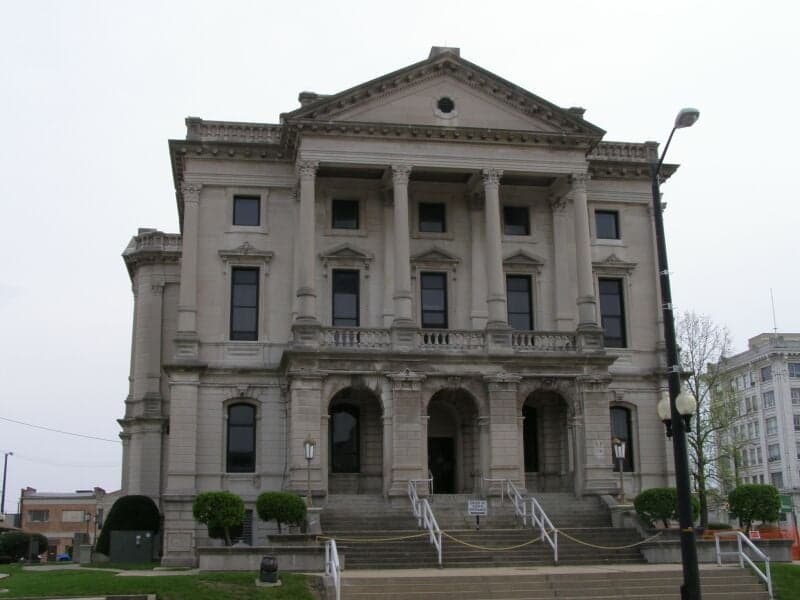
Photo: Wikipedia
Demographics of Grant County
Affluence Level in Grant County
A below-average socioeconomic profile. Incomes, home values, and educational attainment trail the U.S., with higher poverty and unemployment.
People of Grant County
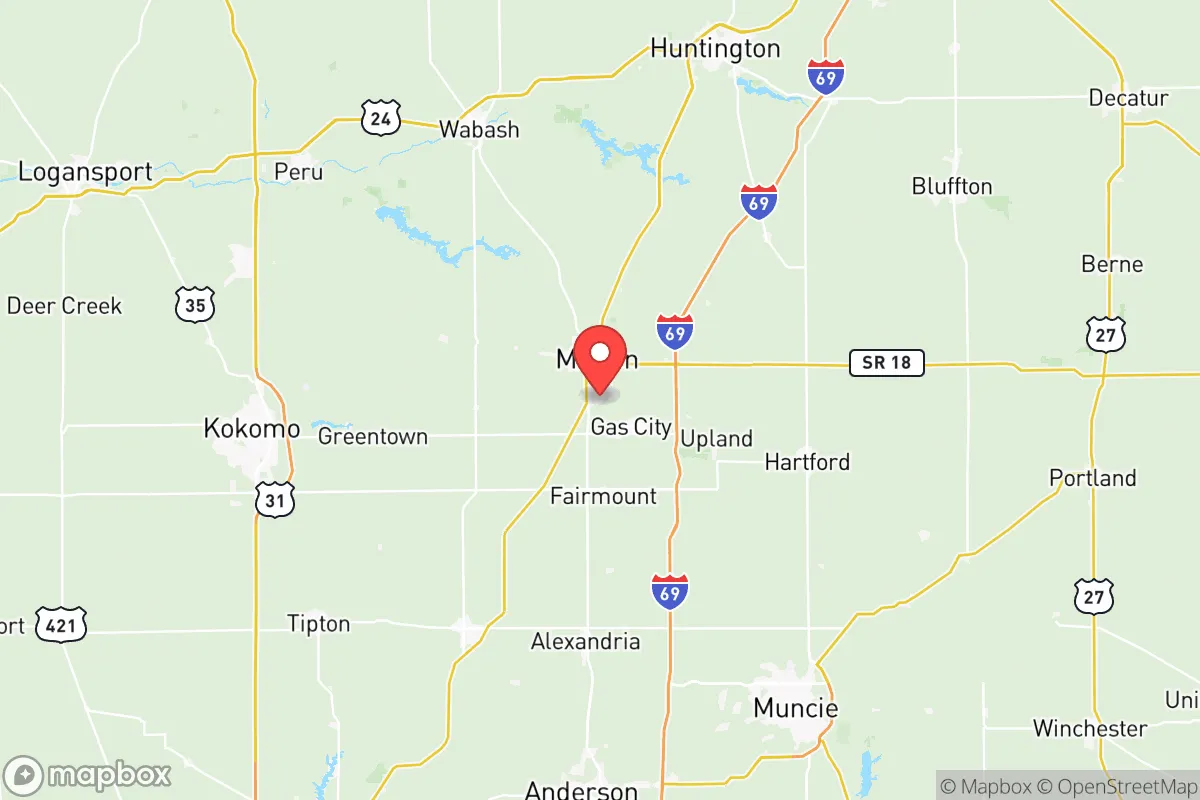
Grant County, Indiana, today is a predominantly white, small-town manufacturing and agricultural hub of 66,377 residents, characterized by a deeply rooted sense of place and a population density of roughly 120 people per square mile. The county’s identity is shaped by its legacy as a glass-making and automotive parts center, a history that attracted waves of European immigrants and later saw a slow, steady diversification. With a foreign-born population of just 1.6% and a college attainment rate of 20.4%, Grant County remains a community where family ties, local industry, and faith-based institutions anchor daily life, particularly in the county seat of Marion and the smaller towns of Gas City, Jonesboro, and Upland.
Settlement & growth (pre-1960)
Before American settlement, the land that is now Grant County was inhabited by the Miami and Lenape (Delaware) nations, who used the Mississinewa River and Wabash River watersheds for hunting and seasonal villages. The area was part of the New Purchase of 1818, a treaty that forced Native cessions and opened central Indiana to Euro-American settlers. The first wave of white settlers, primarily of Scots-Irish and English stock, arrived in the 1820s and 1830s, drawn by cheap federal land and the promise of fertile prairie soil. They founded Marion in 1831 as the county seat, naming it after Revolutionary War General Francis Marion, and established the farming communities of Fairmount and Swayzee along the Mississinewa.
The county’s character shifted dramatically after the discovery of natural gas in the 1880s. The Indiana Gas Boom (1885–1905) turned Grant County into a manufacturing powerhouse, attracting a new wave of immigrants. German and Irish workers arrived in large numbers to labor in the new glass factories and foundries, settling in Gas City (founded 1892, named for the gas boom) and Jonesboro. By 1900, Marion had become a major glass-manufacturing center, home to the Hemingray Glass Company and several bottle and window-glass plants. This industrial pull also brought a smaller number of Italian and Polish immigrants, who formed tight-knit neighborhoods in Marion’s south side and near the rail yards. The county’s population peaked at around 85,000 in the 1920s, fueled by factory jobs and the rise of the automotive parts industry, including the Marion Malleable Iron Works and later the Chrysler foundry.
The Great Depression and the decline of the glass industry led to a gradual population loss, but World War II brought a temporary revival as factories retooled for war production. The post-war period saw a modest influx of Appalachian white migrants from Kentucky and Tennessee, drawn by manufacturing jobs at General Motors’ Marion plant and the Wire Rope Corporation. These families settled in working-class neighborhoods in Marion and Upland, where Taylor University (founded 1846) also began to grow as a conservative Christian college, attracting students and faculty from across the Midwest. By 1960, Grant County was overwhelmingly white (over 97%), with a small Black population concentrated in Marion’s east side, descendants of the Great Migration who had come to work in the foundries during the 1910s and 1920s.
Modern era (post-1965)
The 1965 Hart-Cellar Act had a minimal direct impact on Grant County, as the region did not attract the large-scale immigration seen in coastal or Sun Belt metros. Instead, the county’s demographic story since 1965 has been one of domestic out-migration and slow diversification. Manufacturing consolidation and plant closures—most notably the decline of glass production and the 2008 closure of the Chrysler foundry—led to a steady population decline from 73,000 in 1970 to 66,377 today. Many younger residents left for Indianapolis, Fort Wayne, or out of state, leaving an aging population.
The Hispanic population, now 5.3% of the county, began to grow in the 1990s as Mexican and Central American immigrants arrived to work in agriculture (particularly tomato and soybean farming) and in light manufacturing. These families settled primarily in Marion’s west side and in Gas City, where a small but visible Hispanic commercial corridor has emerged along South Washington Street. The Black population, at 4.8%, has remained relatively stable, concentrated in Marion’s historic east-side neighborhoods and in public housing communities. The Asian population (East/Southeast Asian) is very small at 0.5%, with a handful of families connected to Taylor University or local hospitals. The Indian-subcontinent population, at 0.4%, is almost entirely composed of professionals working at Marion General Hospital or teaching at Taylor University and Indiana Wesleyan University (located just south in Marion).
Suburbanization within the county has been limited. Unlike fast-growing Indiana counties such as Hamilton or Hendricks, Grant County has seen little exurban sprawl from Indianapolis (about 70 miles south). Instead, residents have shifted within the county: Upland has grown modestly due to Taylor University’s expansion, while Fairmount and Swayzee have lost population. The county’s racial and ethnic composition remains far less diverse than the state average (Indiana is 84% white, 10% Black, 8% Hispanic), and the foreign-born share of 1.6% is among the lowest in the state.
The future
Grant County’s population is projected to continue a slow decline, with the Indiana Business Research Center forecasting a drop to roughly 63,000 by 2040. The county is becoming slightly more diverse, but at a pace far slower than the state or nation. The Hispanic share is expected to rise to 7–8% by 2040, driven by natural increase and continued agricultural labor demand, while the Black and Asian shares are likely to remain stable or grow only marginally. The white population, already aging, will continue to shrink as younger adults leave for larger job markets.
New residents are most likely to be retirees drawn by low housing costs and the rural lifestyle, or remote workers seeking a low-cost base near a small city. The county’s cultural identity—conservative, church-centered, and rooted in manufacturing heritage—is unlikely to shift dramatically, though the growing Hispanic community in Marion and Gas City is gradually adding bilingual services and Catholic and evangelical Spanish-language congregations. The biggest wildcard is the potential for economic revival: if the former Chrysler site or the Marion Industrial Park attracts new employers, the county could see a modest reversal of population loss, but no major growth is expected.
For someone moving in now, Grant County offers a stable, affordable, and culturally homogeneous environment where community ties run deep and the pace of life is slow. It is not a place of rapid demographic change or urban energy, but rather a quiet, family-oriented corner of the Midwest where the past still shapes the present. The people are predominantly white, native-born, and conservative-leaning, with a small but growing Hispanic presence and a tiny professional class connected to the area’s universities and hospitals. If you are seeking a low-cost, low-drama community with strong churches and a sense of history, Grant County fits that mold—but it is not a place where you will find the diversity or dynamism of Indiana’s growing metros.

* Values derived from national, state, county, city and local statistics and may differ in a specific area. Last updated: 2026-07-15T04:47:51.000Z
Narrative content on this page is AI-generated and may contain mistakes. Verify any details that matter before acting on them.
ReloMaps may earn a commission from affiliate links at no extra cost to you.

