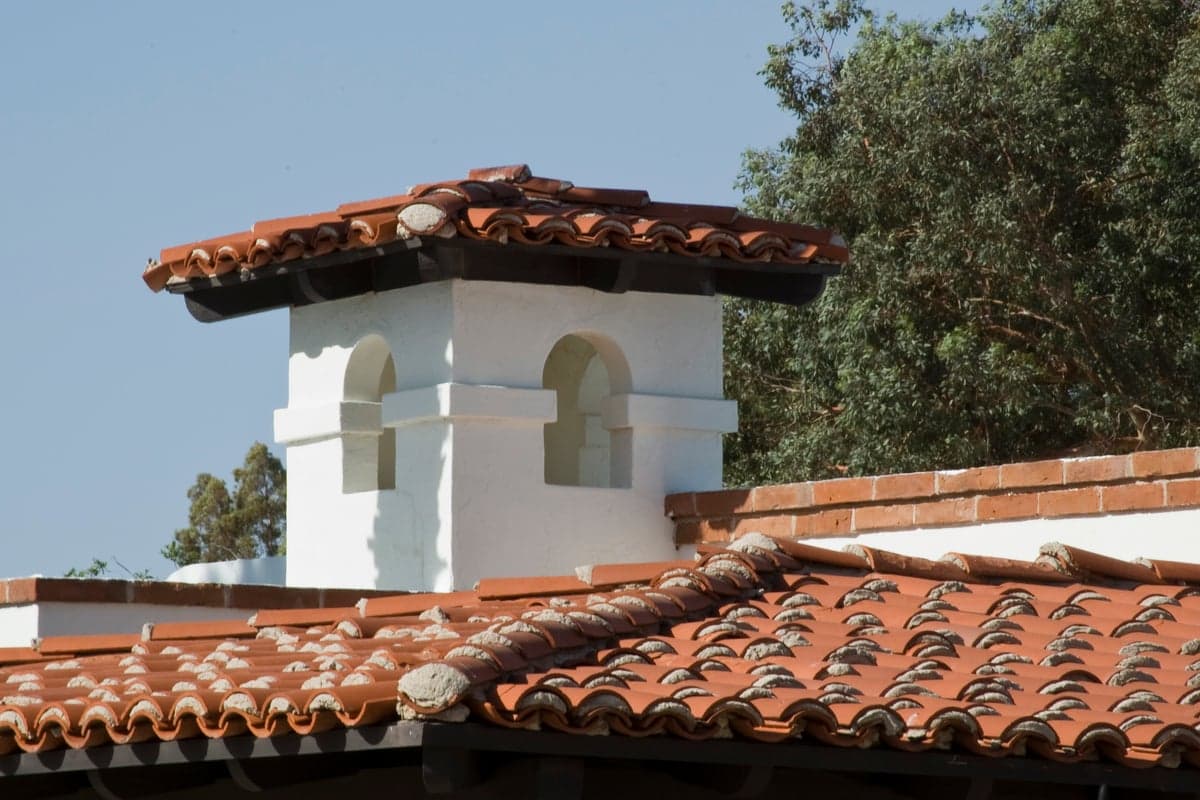
Photo: Wikipedia
Demographics of Green Valley, AZ
Affluence Level in Green Valley, AZ
A middle-class area roughly in line with national averages across income, home values, education, and employment.
People of Green Valley, AZ
Green Valley, Arizona, is a planned retirement community of 21,581 residents where the population skews overwhelmingly white (92.0%) and older, with a distinctive identity built around active-adult living, golf courses, and a quiet, security-conscious desert lifestyle. The city is one of the least ethnically diverse in the Phoenix-Tucson corridor, with a Hispanic population of just 5.4%, a foreign-born share of only 2.9%, and a 44.0% college-educated rate that reflects its professional and military retiree base. Unlike most Arizona towns, Green Valley has no historic mining or ranching roots; it was purpose-built in the 1960s as a winter haven for Midwestern snowbirds and has evolved into a year-round community of conservative-leaning seniors and a growing number of working-age service workers.
How the city was settled and grew
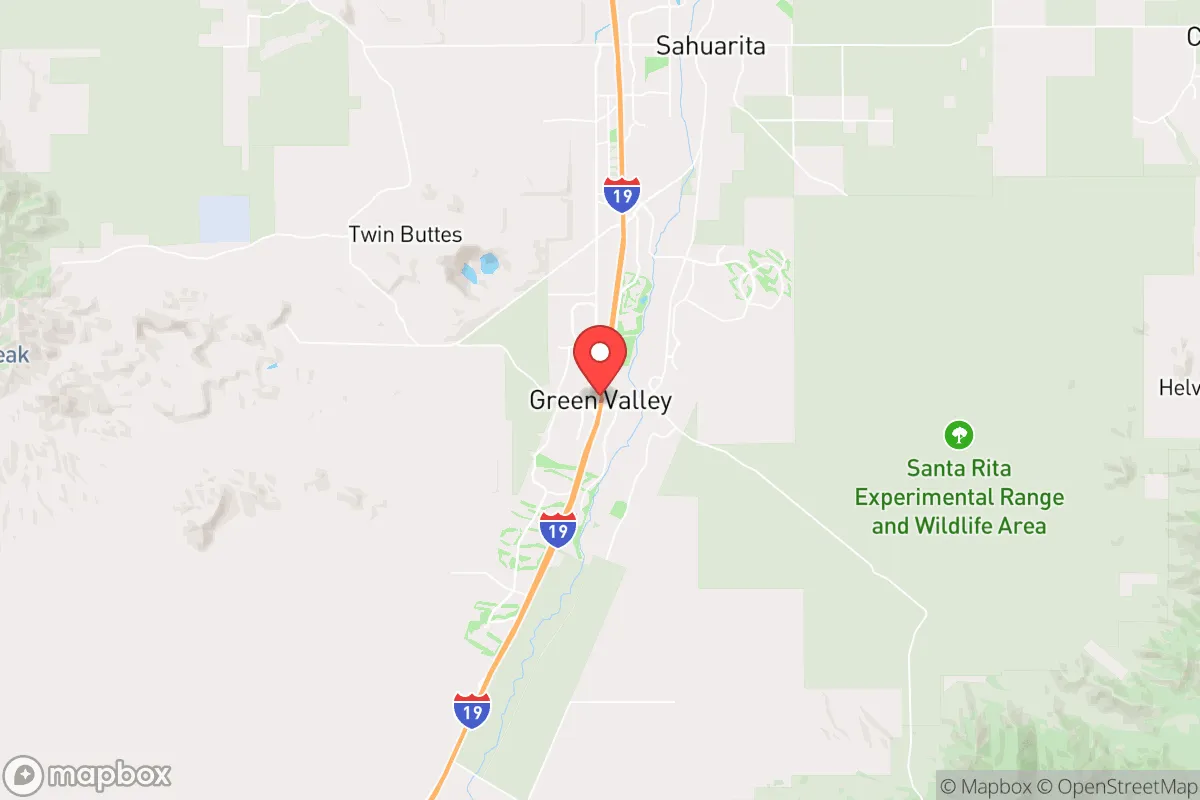
Green Valley is a genuinely post-1960 planned community, with no pioneer-era founding. The land was part of the sprawling 12,000-acre Rancho del Nogales, a cattle ranch owned by the Greene family, who sold it to developer John R. Green in 1961. Green, a Tucson-based land investor, envisioned a master-planned retirement destination along Interstate 19, roughly 25 miles south of Tucson. The first homes went up in 1965 in the Desert Hills and Canoa Ranch subdivisions, marketed aggressively to retirees from the Midwest and Great Lakes states—particularly Illinois, Ohio, and Michigan—who wanted to escape harsh winters without leaving the continental U.S. The early buyers were almost entirely white, middle-class couples in their 50s and 60s, drawn by the promise of golf, warm winters, and a gated, low-crime environment. The community grew steadily through the 1970s and 1980s, with new sections like Green Valley Proper and Quail Creek adding hundreds of single-story, stucco homes designed for aging in place.
Modern era (post-1965)
Green Valley's modern demographic character was set in the 1970s and has changed remarkably little since. The post-1965 immigration reforms that reshaped most of the Southwest barely touched this community; the foreign-born population today is just 2.9%, compared to roughly 13% for Arizona as a whole. Instead, the city grew through domestic in-migration—specifically, a steady pipeline of retirees from the Midwest and, increasingly, from California and the Pacific Northwest. The Continental Reserve and Madera Vista neighborhoods, built in the 1990s and 2000s, absorbed much of this later wave, attracting younger retirees (55–65) who still wanted proximity to Tucson's hospitals and the University of Arizona. The Hispanic population, at 5.4%, is concentrated almost entirely in the workforce—service, landscaping, and healthcare workers who commute from nearby Sahuarita and Tucson, not in the gated communities themselves. East and Southeast Asian residents make up just 0.7% of the population, and the Indian-subcontinent share is effectively zero (0.0%). Black residents account for 0.4%. The city remains, in practice, a white, affluent, and politically conservative enclave; Pima County as a whole leans Democratic, but Green Valley precincts consistently vote Republican by wide margins, and the local culture reflects that—flag displays, veterans' organizations, and a strong homeowners' association presence are defining features.
The future
Green Valley's population is aging in place, and the demographic trajectory points toward a slow, modest diversification rather than a dramatic shift. The median age is well above 70, and as the original snowbird generation passes, their homes are being purchased by a slightly younger cohort—many of them early retirees from California and Colorado seeking lower cost of living and no state income tax. The East Side and West Side districts, divided by Interstate 19, are seeing the most turnover, with some older homes being bought by working-age families who commute to Tucson or work in Sahuarita's growing industrial parks. The Hispanic share is expected to rise gradually—perhaps to 8–10% by 2040—as service workers and their families move into unincorporated areas just outside the city limits, but the gated communities themselves will likely remain overwhelmingly white. The city is also seeing a small but notable influx of East and Southeast Asian retirees, particularly from California's Chinese and Vietnamese communities, drawn by the same climate and cost advantages as their white counterparts. The cultural identity is evolving from a pure retirement haven to a more mixed community of retirees, remote workers, and healthcare professionals, but the core character—quiet, safe, conservative, and golf-centric—is unlikely to change fundamentally.
For someone moving to Green Valley today, the bottom line is this: you are entering a community that is stable, affluent, and demographically homogeneous, with a strong senior presence and a culture built around outdoor recreation and civic volunteerism. The population is not shrinking, but it is slowly turning over, and the next decade will bring more working-age families and a slightly more diverse mix, particularly in the unincorporated fringe areas. If you are looking for a quiet, safe, conservative-leaning desert community with excellent healthcare access and a predictable social rhythm, Green Valley delivers exactly that—but if you seek ethnic diversity or a youthful, dynamic population, this is not the place.

* Values derived from national, state, county, city and local statistics and may differ in a specific area. Last updated: 2026-10-13T01:03:45.000Z
Narrative content on this page is AI-generated and may contain mistakes. Verify any details that matter before acting on them.
ReloMaps may earn a commission from affiliate links at no extra cost to you.

