Demographics of Naugatuck Valley Planning Region County
Historical data isn't available for Naugatuck Valley Planning Region County. Trends shown are for Connecticut, Connecticut.
Affluence Level in Naugatuck Valley Planning Region County
A middle-class area roughly in line with national averages across income, home values, education, and employment.
People of Naugatuck Valley Planning Region County
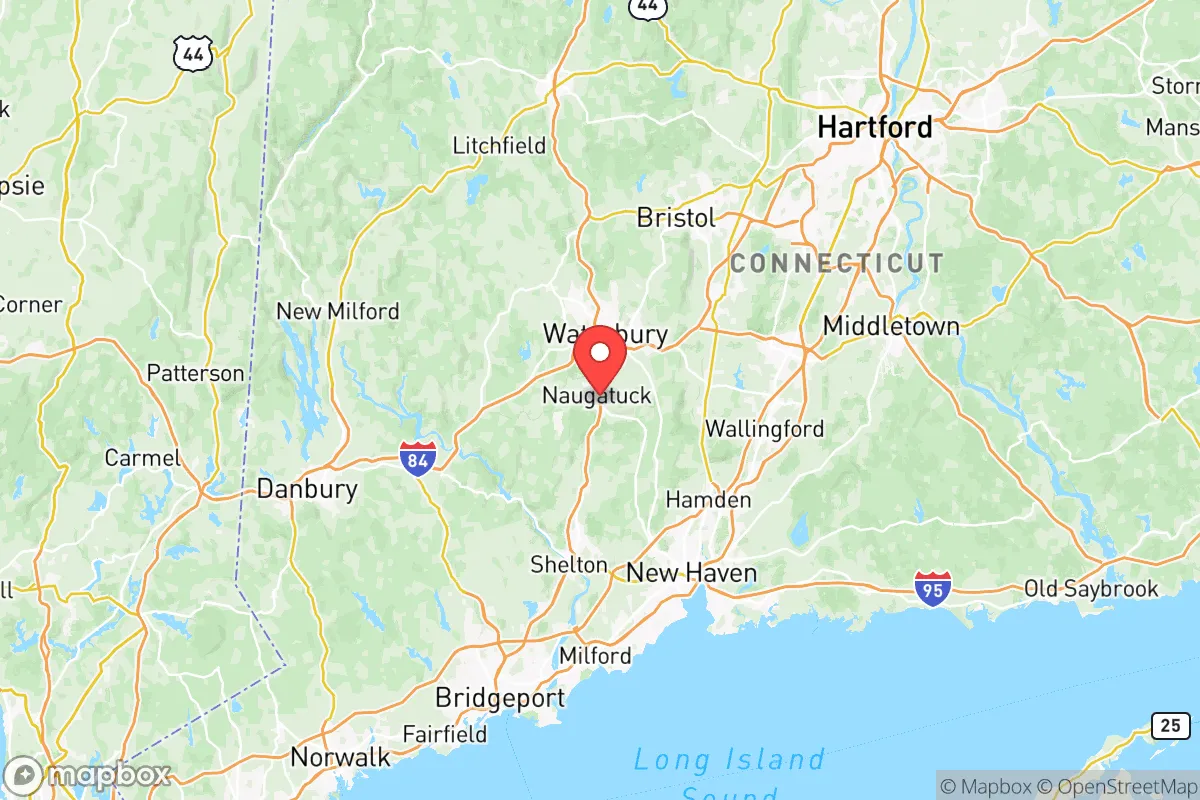
The Naugatuck Valley Planning Region in Connecticut is home to roughly 452,000 residents, a population shaped by over a century of industrial migration and suburban expansion. Today, the region is predominantly white (61.1%) with a significant Hispanic community (19.2%) and a notable Black population (10.3%), reflecting its evolution from a manufacturing powerhouse to a more diverse, service-oriented economy. The area’s identity remains rooted in its historic brass and manufacturing towns—places like Waterbury, Naugatuck, and Ansonia—where dense urban centers give way to leafy suburbs and small industrial villages.
Settlement & growth (pre-1960)
Before European settlement, the Naugatuck Valley was home to the Paugussett and Tunxis tribes, Algonquian-speaking peoples who lived along the Naugatuck River. English colonists from the Connecticut Colony began arriving in the late 1600s, establishing farming communities in what are now Derby (founded 1642) and Waterbury (settled 1674). These early settlers were primarily of English descent, drawn by fertile river valleys and access to Long Island Sound via the Housatonic River.
The region’s character changed dramatically in the 19th century with the rise of brass manufacturing. Waterbury became known as the “Brass City,” and by the 1840s, Irish immigrants fleeing the Great Famine arrived to work in the mills and factories. They concentrated in Waterbury’s South End and in Naugatuck, where they built St. Francis Church (1851) and established a lasting Catholic presence. The 1880s and 1890s brought a second wave: Italian immigrants, who settled heavily in Waterbury’s North End and in the town of Wolcott, working in brass foundries and clock factories. By 1910, Italians made up over 20% of Waterbury’s population.
Eastern European Jews arrived between 1880 and 1920, fleeing pogroms in Russia and Poland. They established a tight-knit community in Waterbury’s East End, centered around Grand Street, and built synagogues like Beth El (1891). At the same time, Polish immigrants settled in Ansonia and Seymour, working in the Ansonia Copper & Brass mills. The 1920s saw a smaller influx of French Canadians, who moved into Derby and Shelton for factory jobs. By 1930, the Naugatuck Valley was one of Connecticut’s most ethnically diverse regions, with a population that was roughly 40% foreign-born.
The Great Depression and World War II slowed immigration, but the post-war boom brought domestic migrants from rural New England and Appalachia. These “hill people” settled in working-class neighborhoods in Waterbury and Bristol, taking jobs in the still-thriving manufacturing sector. The 1950s also saw the first wave of suburbanization, as families moved from dense city centers to new developments in Middlebury and Southbury, drawn by the promise of larger homes and yards.
Modern era (post-1965)
The 1965 Hart-Cellar Act fundamentally reshaped the Naugatuck Valley’s demographics. The first major post-1965 group was Puerto Ricans, who began arriving in the 1970s, drawn by factory jobs that were still available in Waterbury and Naugatuck. They concentrated in Waterbury’s South End and Brooklyn neighborhoods, establishing bodegas, Pentecostal churches, and community organizations like the Puerto Rican Cultural Center. By 1990, Puerto Ricans made up roughly 10% of Waterbury’s population.
The 1980s and 1990s brought a second wave of Hispanic immigration, this time from the Dominican Republic and Mexico. Dominicans settled primarily in Waterbury’s East End, while Mexicans concentrated in Naugatuck and Ansonia. Today, the Hispanic population stands at 19.2% of the region’s total, with Waterbury alone being over 40% Hispanic. The community has become a political and economic force, with Hispanic-owned businesses lining Waterbury’s Bank Street and East Main Street.
Black migration to the region has a longer history but accelerated after 1965. African Americans from the rural South—particularly Virginia and the Carolinas—came during the Great Migration (1910-1970) for manufacturing jobs. They settled in Waterbury’s North End and in Derby, where they built churches like Mount Olive Baptist (1921). Since 1965, the Black population has grown more slowly, reaching 10.3% of the region today, with concentrations in Waterbury and Ansonia. A smaller but growing Afro-Caribbean community, primarily from Jamaica and Haiti, has formed in Waterbury since the 1990s.
East and Southeast Asian communities (2.3% of the population) arrived later, primarily after 1990. Chinese immigrants, many from Fujian province, settled in Waterbury’s downtown, opening restaurants and grocery stores. A smaller Vietnamese community, refugees from the post-1975 wave, concentrated in Naugatuck and Seymour. Indian subcontinent immigrants (1.6%) began arriving in the 2000s, drawn by professional jobs in healthcare and engineering. They settled not in the old industrial centers but in the suburbs: Southbury, Middlebury, and Oxford, where they built Hindu temples and community centers.
Domestic migration since 1965 has been equally transformative. The decline of manufacturing in the 1970s and 1980s triggered a population loss in Waterbury (from 108,000 in 1960 to 103,000 in 1990), as white working-class families moved to outer suburbs like Prospect and Bethlehem. The 1990s and 2000s saw a reverse migration of young professionals and empty-nesters back to Waterbury’s historic downtown, drawn by affordable Victorian housing and commuter rail access to New Haven and New York. This “back-to-the-city” movement has been modest but steady, with Waterbury’s population stabilizing around 114,000 since 2010.
The future
The Naugatuck Valley is becoming more diverse, but slowly. The white share of the population has declined from roughly 75% in 1990 to 61.1% today, while the Hispanic share has grown from 8% to 19.2%. This trend is expected to continue, driven by higher birth rates among Hispanic families and continued immigration from Latin America. The Asian and Indian populations, though small, are growing rapidly—the Indian community has doubled since 2010, concentrated in the professional suburbs of Southbury and Oxford.
Geographically, the region is seeing a dispersal of new immigrant groups. While Waterbury remains the primary entry point for Hispanic and Black newcomers, second-generation families are moving to suburbs like Wolcott, Cheshire, and Beacon Falls. The Indian and East Asian communities are skipping the urban core entirely, settling directly in suburban towns with good schools and larger homes. This pattern is creating a more polycentric region, where cultural diversity is spread across multiple towns rather than concentrated in a single ethnic enclave.
The region’s cultural identity is evolving from its “Brass City” industrial past toward a more mixed identity: part post-industrial urban (Waterbury), part commuter suburb (Southbury, Middlebury), and part rural retreat (Bethlehem, Woodbury). The next 10-20 years will likely see continued Hispanic growth, a modest increase in Asian and Indian populations, and a slow decline in the white share. The region will remain less diverse than Connecticut’s coastal cities (Bridgeport, New Haven) but more diverse than the state’s rural northeast.
For someone moving in now, the Naugatuck Valley offers a region in transition: affordable housing in historic mill towns, growing suburban diversity, and a population that is becoming more Hispanic and more professional. The old ethnic divisions—Irish, Italian, Polish, Jewish—are fading, replaced by a newer mosaic of Puerto Rican, Dominican, Indian, and Chinese communities. The region is not a melting pot in the classic sense, but a patchwork of distinct towns and neighborhoods, each with its own character and history.

* Values derived from national, state, county, city and local statistics and may differ in a specific area. Last updated: 2026-07-09T11:51:32.000Z
Narrative content on this page is AI-generated and may contain mistakes. Verify any details that matter before acting on them.
ReloMaps may earn a commission from affiliate links at no extra cost to you.

