Photo: Wikipedia
Demographics of Chelsea, AL
Affluence Level in Chelsea, AL
An upper-middle-class area. Household wealth, education levels, and homeownership run ahead of national benchmarks.
People of Chelsea, AL
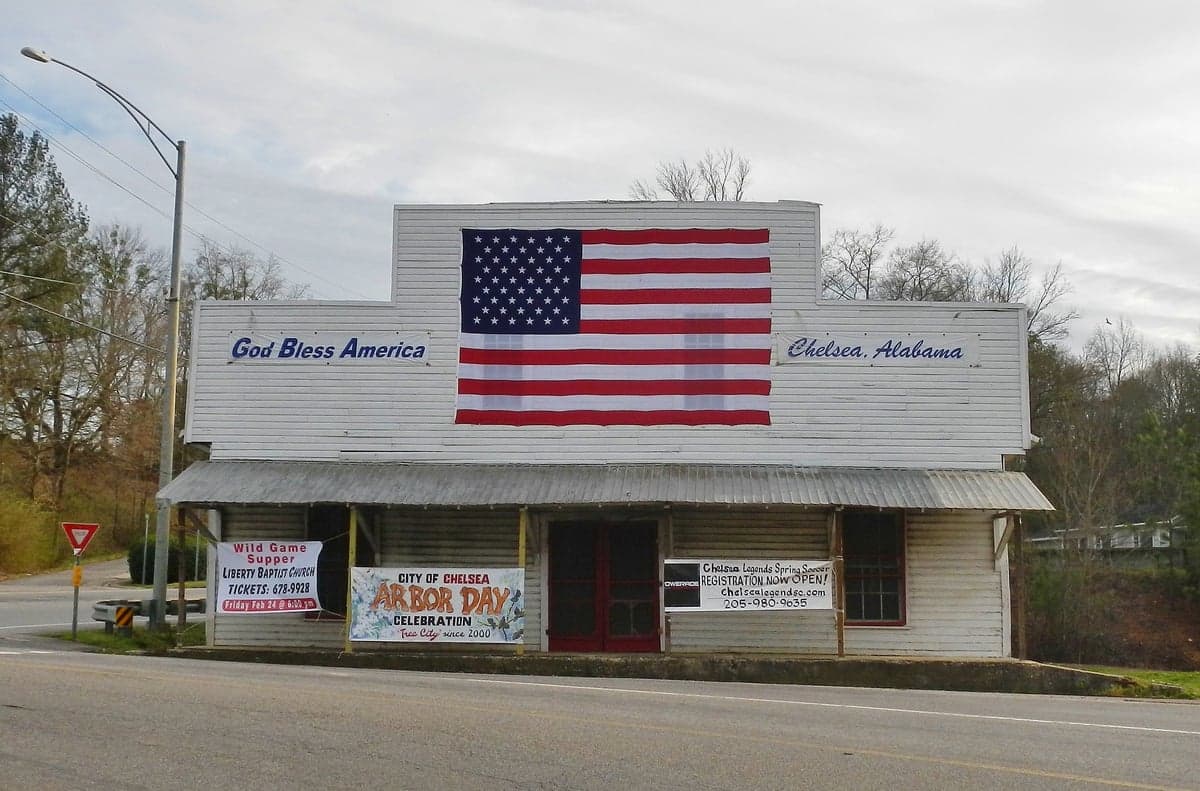
The people of Chelsea, Alabama, today form a predominantly white, family-oriented suburban community of 15,731 residents, characterized by high educational attainment (44.9% college-educated) and low ethnic diversity. The city’s identity is rooted in its rapid transformation from a rural crossroads to a bedroom community for Birmingham, with a population that is 83.7% white, 7.4% Black, and 5.5% Hispanic, while foreign-born residents make up just 1.7% of the total. This is a place where newcomers are drawn by new construction, good schools, and a sense of safety, rather than by historic industry or deep-rooted ethnic enclaves.
How the city was settled and grew
Chelsea’s human history begins not with a grand founding but with slow, agricultural settlement in the early 19th century. The area was originally part of the Creek Nation before the Treaty of Fort Jackson (1814) opened it to white settlers. Early residents were subsistence farmers and small-scale cotton growers, drawn by cheap land grants in the fertile Cahaba Valley. The community remained a tiny, unincorporated hamlet for over a century, with the first post office established in 1850. The arrival of the Louisville and Nashville Railroad in the late 1800s spurred modest growth, but Chelsea never developed a dense historic core. Instead, settlement clustered around the Old Highway 280 corridor, with families building homesteads on large lots in what are now the Old Town Chelsea and Chelsea Crossroads areas. These neighborhoods retain a scattering of antebellum and early-20th-century homes, but the population remained under 500 until the 1970s. The original population was almost entirely white, with a small number of Black families who worked as sharecroppers on surrounding farms; their descendants are today concentrated in the Briarwood and Lake Purdy areas, though these communities have been largely absorbed by suburban development.
Modern era (post-1965)
The modern population of Chelsea is a product of post-1965 suburbanization, driven by the expansion of Birmingham’s white-collar economy and the construction of U.S. Highway 280. The 1970s and 1980s saw the first wave of domestic in-migration: middle-class families, overwhelmingly white, moving from Birmingham and its inner-ring suburbs to escape crime and school consolidation. They built homes in subdivisions like Savannah Place and Forest Lakes, which remain predominantly white and upper-middle-class today. The 1990s and 2000s brought a second, larger wave as Chelsea incorporated as a city in 1996 and began aggressively annexing land. New subdivisions such as Sterling Crest and Greystone Legacy attracted families from across the Birmingham metro, including a growing number of Black professionals (now 7.4% of the population) and a small but visible Hispanic community (5.5%), many of whom work in construction, landscaping, and service industries. The Hispanic population is dispersed rather than concentrated, though a modest cluster has formed in the Old Town Chelsea area near rental properties and mobile home parks. East/Southeast Asian residents (0.3%) and Indian-subcontinent residents (0.0%) are negligible, reflecting Chelsea’s lack of the tech or academic anchors that draw these groups to other Birmingham suburbs. The foreign-born share (1.7%) is among the lowest in Shelby County, reinforcing the city’s character as a destination for native-born Americans seeking a homogeneous, family-oriented environment.
The future
Chelsea’s population is projected to continue growing, driven by ongoing residential construction and the extension of sewer infrastructure along the Highway 280 corridor. The city’s demographic trajectory points toward modest diversification, but at a slower pace than the Birmingham metro as a whole. The Hispanic share is likely to rise gradually as service-sector employment grows, while the Black population may increase as more professionals seek newer, larger homes in subdivisions like Savannah Place and Sterling Crest. However, the East/Southeast Asian and Indian-subcontinent populations are expected to remain very small, as Chelsea lacks the specialized employment base—such as research hospitals or engineering firms—that attracts these groups to suburbs like Hoover or Vestavia Hills. The city’s cultural identity is evolving from a purely white, rural-suburban enclave to a more diverse but still predominantly white, conservative-leaning community. New neighborhoods are dispersing along the Highway 280 corridor rather than concentrating in a single area, reinforcing a low-density, car-dependent lifestyle. For a family moving in now, Chelsea offers a stable, safe, and education-focused environment, but one where ethnic and cultural diversity remains limited and where the population is likely to become slightly more varied rather than dramatically transformed.
In short, Chelsea is becoming a more diverse version of its former self—still overwhelmingly white and native-born, but with a growing Hispanic and Black presence that is slowly reshaping its suburban identity. For a relocating family, this means access to top-rated Shelby County schools and new housing stock, but also a community where the social fabric remains largely homogeneous and where the pace of change is measured in decades, not years.

* Values derived from national, state, county, city and local statistics and may differ in a specific area. Last updated: 2026-09-27T14:20:49.000Z
Narrative content on this page is AI-generated and may contain mistakes. Verify any details that matter before acting on them.
ReloMaps may earn a commission from affiliate links at no extra cost to you.

