
Photo: Wikipedia
Quality of Life in Barnstable Town, MA
A high quality of life with strong walkability, manageable living costs, healthy neighborhood signals, and solid amenity access.
What does Quality of Life tell us?
Quality of Life blends cost of living, nearby amenities, socioeconomic signals, and neighborhood character. City-level scores represent the whole municipality; individual neighborhoods can differ.
What does this tell us?
Quality of Life blends cost of living, nearby amenities, socioeconomic signals, and neighborhood character. City-level scores represent the whole municipality; individual neighborhoods can differ.
Cost of Living
70% above national average
The Real Cost of Living in Barnstable Town, MA for 2026
| Tier | Individual | Family (4) |
|---|---|---|
| Survival | $28k | $53k |
| Comfortable | $109k | $160k |
| Luxury | $169k+ | $261k+ |
| Elite (Top 5%) | $198k+ | $308k+ |
61%
The Area Signal
A metric tracking the socioeconomic signals of the area.
Hobbies
Explore the areaGroceries
4 within 10 miles
Gas
20 within 10 miles
Hospital
7 within 20 miles
Airport
PDX — Portland International Jetport
Post Office
USPS — 1317 Falmouth Road, Barnstable
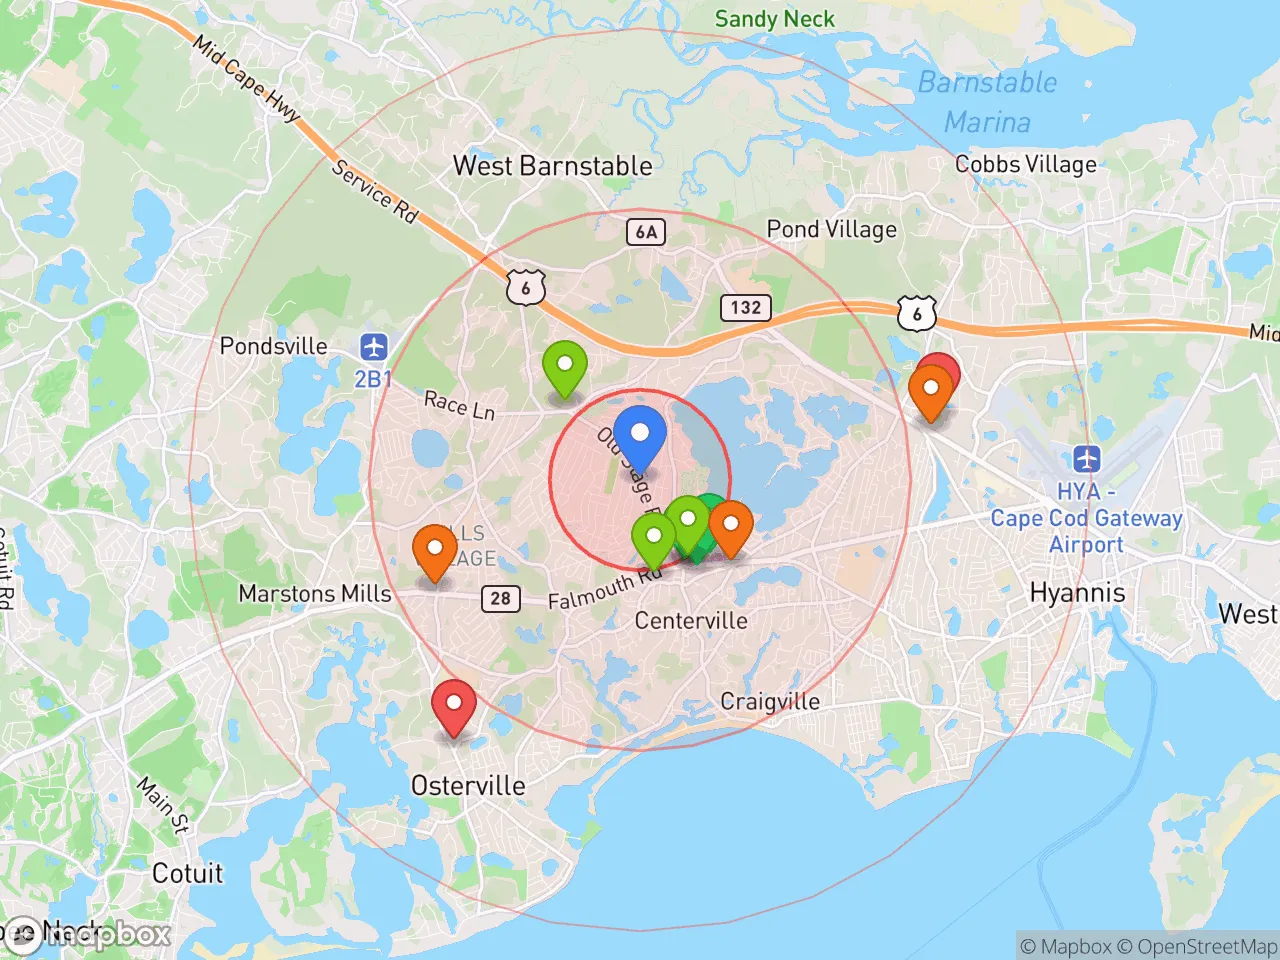
Critical Amenities
Quality-of-Life Analysis
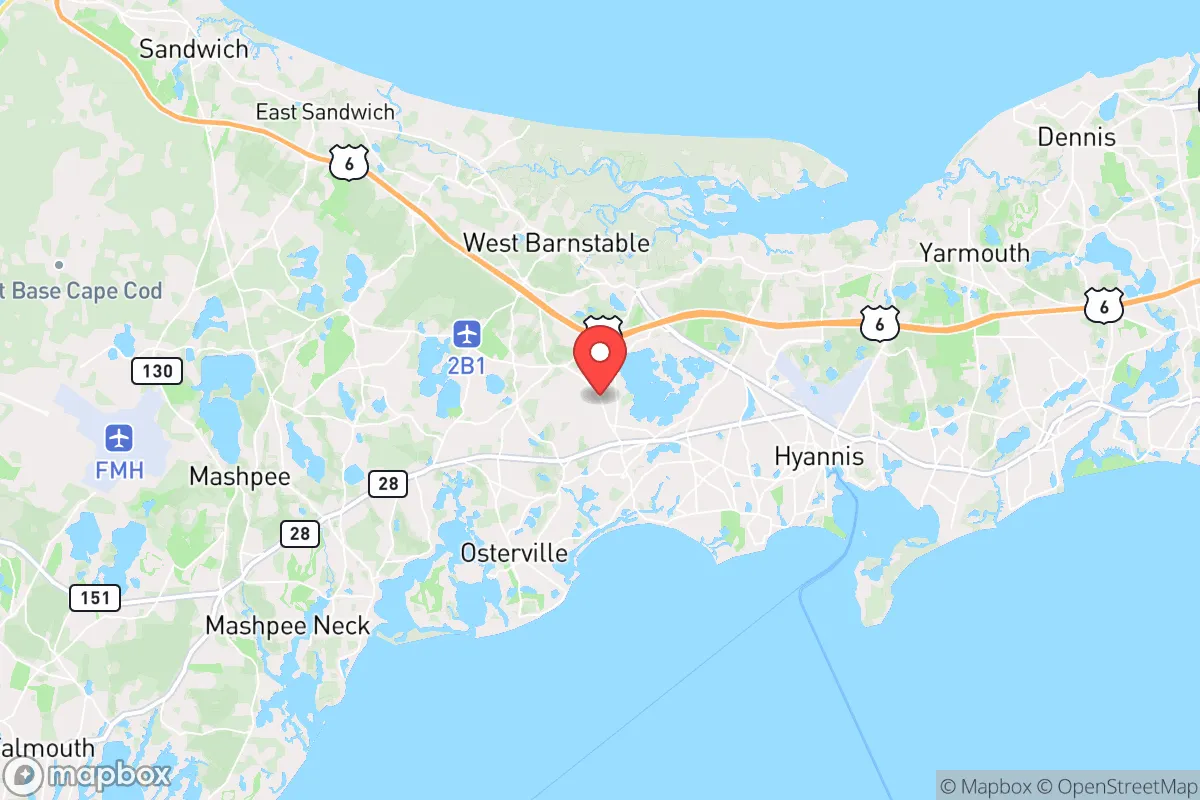
Barnstable Town, the largest of Cape Cod's 15 towns by population, presents a quality of life defined by coastal affluence and a distinctly seasonal rhythm. With a cost of living index of 170—70 percent above the national average—the area attracts a mix of affluent retirees, second-home owners, and professionals willing to pay a premium for ocean proximity. The permanent population of roughly 45,000 swells dramatically in summer, shaping both the local economy and daily pace of life.
Cost of living, housing affordability, and how Barnstable compares to nearby areas
Housing is the primary driver of Barnstable's elevated cost of living. The median home value sits at $559,200, significantly higher than the Massachusetts state median of roughly $480,000 and more than double the national figure. Renters face a median monthly cost of $1,751, which is manageable for dual-income households but steep for service workers who power the tourism economy. Compared to nearby Hyannis (a village within Barnstable Town) or Sandwich, home values are roughly 10–15 percent higher in Barnstable proper due to its direct oceanfront and harbor access. The average commute of 25 minutes is notably short for the Boston region—many residents work locally in hospitality, healthcare, or retail, while a smaller cohort commutes to the mainland via the Sagamore Bridge. Property taxes in Barnstable average about 0.8 percent of assessed value, slightly below the state average, offering some relief to homeowners.
What daily life is like for families: schools, amenities, and seasonal rhythm
Barnstable's public school system, Barnstable Public Schools, serves roughly 4,500 students across seven elementary schools, a middle school, and Barnstable High School. The high school offers a strong Advanced Placement program and is known for its performing arts and marine science electives. For daily amenities, the town is anchored by the Hyannis commercial district, which includes the Cape Cod Mall, grocery stores, and the Hyannis Transportation Center—a hub for ferries to Nantucket and Martha's Vineyard. Outdoor life revolves around five public beaches, including Craigville Beach and Kalmus Beach, plus the 1,500-acre Long Pasture Wildlife Sanctuary. The seasonal rhythm is pronounced: from Memorial Day through Labor Day, traffic on Route 28 and Main Street intensifies, restaurant wait times double, and parking near the harbor becomes scarce. Off-season, the pace slows considerably, with many restaurants and shops operating reduced hours or closing entirely from November through March. Healthcare access is solid, with Cape Cod Hospital in Hyannis providing emergency and specialty care.
Who thrives here? Barnstable Town is best suited for households with a combined income above $120,000 who can absorb the high housing costs and appreciate a coastal lifestyle that shifts between bustling summers and quiet winters. Retirees and remote workers with flexible schedules benefit most from the off-season tranquility, while families with school-age children find a safe, nature-rich environment with good public schools. Those seeking vibrant nightlife, diverse employment outside tourism, or year-round urban energy will find Barnstable limiting. For buyers and renters willing to pay the premium, the trade-off is daily access to Cape Cod Bay, a strong sense of community in each of the town's seven villages, and a commute that rarely exceeds half an hour.
Crime in Barnstable Town, MA
Generally safer than 71% of comparable U.S. locations.
Violent CrimeViolent Crime Analysis
Property CrimeProperty Crime Analysis
Crime Analysis
Barnstable Town, the largest of Cape Cod’s seven towns, presents a safety profile that is notably safer than the national average but requires careful scrutiny due to the influence of progressive criminal justice policies common in Massachusetts. With a violent crime rate of 235.8 incidents per 100,000 residents and a property crime rate of 813.5 per 100,000, the town’s numbers are below the U.S. averages of roughly 380 and 1,950 per 100,000, respectively. However, the local justice system’s emphasis on rehabilitation over incarceration—a hallmark of liberal-leaning district attorneys in the region—means that repeat offenders and those charged with non-violent property crimes often face minimal detention, a dynamic that directly impacts public safety and victim satisfaction.
Crime in context
Barnstable’s violent crime rate is approximately 38% lower than the national average, while its property crime rate is about 58% lower. These figures place the town in a safer tier than many comparably sized New England communities. Yet the gap between local and state rates is narrower: Massachusetts’ statewide violent crime rate is roughly 300 per 100,000, meaning Barnstable is about 21% below its own state’s average. Property crime in Barnstable is also below the state average of approximately 1,100 per 100,000. The presence of progressive district attorneys in Barnstable County, who prioritize diversion programs and reduced sentencing for non-violent offenders, is a key factor. While this approach aims to reduce recidivism, it often results in shorter jail terms for property criminals, who may cycle back into the community more quickly, raising concerns for residents and business owners.
What residents experience
For daily life, the most tangible safety issue is property crime, particularly in tourist-heavy areas like Hyannis and along the waterfront. Theft from vehicles, bicycle theft, and break-ins at seasonal rentals are common complaints. Violent crime is less frequent but not absent; incidents are often concentrated in specific commercial corridors and near public transportation hubs. The town’s police department is well-funded and responsive, but the broader judicial environment means that arrests for property crimes do not always lead to sustained incarceration. Residents report that this can create a sense of impunity among repeat offenders, especially during the summer months when the population swells. The progressive “bail reform” laws in Massachusetts, which limit cash bail for many non-violent charges, further contribute to this dynamic, as suspects are often released pending trial.
Neighborhood-level variation is significant. The village of Hyannis, the town’s commercial and transportation center, has a higher concentration of both property and violent crime, particularly around Main Street and the bus terminal. In contrast, outlying villages like Osterville, Cotuit, and Centerville experience far fewer incidents, with violent crime being rare. Property crime rates in Hyannis can be two to three times higher than in the western villages, a disparity driven by population density, tourism, and the presence of seasonal workers. For those considering a move, choosing a village with lower foot traffic and fewer transient populations is a practical step to mitigate exposure to the region’s justice system shortcomings.
* Values derived from national, state, county, city and local statistics and may differ in a specific area. Last updated: 2026-05-01T11:08:36.000Z
Narrative content on this page is AI-generated and may contain mistakes. Verify any details that matter before acting on them.
ReloMaps may earn a commission from affiliate links at no extra cost to you.