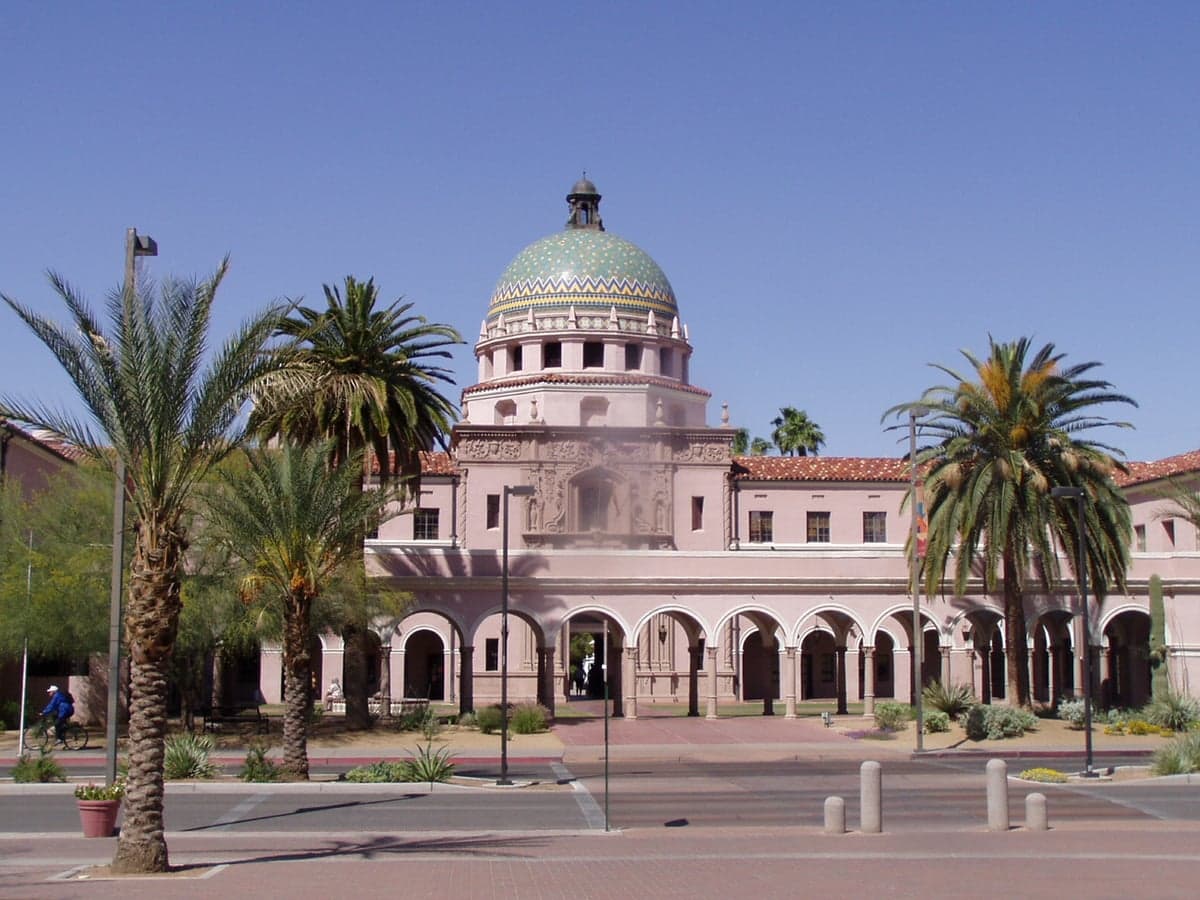
Photo: Wikipedia
Demographics of Pima County
Affluence Level in Pima County
A middle-class area roughly in line with national averages across income, home values, education, and employment.
People of Pima County
Pima County is home to just over one million residents, a population shaped by centuries of layered migration from Native nations, Spanish colonists, Mexican settlers, and Anglo-American pioneers, followed by late-20th-century Sun Belt growth and a steady influx from the Midwest and California. Today the county is 51.2% White, 36.1% Hispanic, 3.3% Black, 2.3% East/Southeast Asian, and 0.6% Indian subcontinent, with 5.5% foreign-born and 35.9% holding a college degree. Its character blends a deep-rooted Hispanic and Indigenous heritage with a growing professional class drawn to the University of Arizona and the region's aerospace and defense industries. The population is concentrated in Tucson, the county seat and only major city, with smaller communities like Oro Valley, Marana, Sahuarita, and Green Valley radiating outward.
Settlement & growth (pre-1960)
The Tohono O'odham and the Pascua Yaqui are the original peoples of the Sonoran Desert that became Pima County, with settlements along the Santa Cruz River dating back thousands of years. Spanish colonization arrived in the late 17th century, when Jesuit missionary Eusebio Kino established Mission San Xavier del Bac in 1692, still standing south of Tucson. The Spanish crown granted land to settlers, and a small ranching and farming population of Spanish and Mexican origin took root around the presidio of Tucson, founded in 1775. After Mexico gained independence in 1821, the area remained a remote frontier outpost with fewer than 1,000 residents, mostly of Mexican descent, living in adobe houses clustered near the Santa Cruz River.
The United States acquired southern Arizona through the Gadsden Purchase in 1854, and Tucson was incorporated in 1877. The arrival of the Southern Pacific Railroad in 1880 transformed the region, bringing Anglo-American merchants, miners, and speculators from the eastern United States. Silver and copper mining booms in towns like Tombstone (briefly part of Pima County before Cochise County split off) and later Ajo drew Cornish, Irish, and German miners. By 1900, Tucson's population had grown to about 7,500, roughly half Mexican-American and half Anglo, with a small Chinese community that had arrived as railroad laborers. The Chinese Exclusion Act of 1882 froze further immigration, but a Chinatown persisted near the railroad depot until the mid-20th century.
The early 20th century saw the establishment of the University of Arizona in Tucson in 1885, which gradually attracted faculty, students, and a professional class. The 1910 Mexican Revolution drove thousands of refugees north into Pima County, many settling in Tucson's Barrio Viejo and South Tucson, a separate city incorporated in 1936 that became a predominantly Mexican-American enclave. The Dust Bowl and Great Depression brought Anglo migrants from Oklahoma, Texas, and the Plains states, though in smaller numbers than in California's Central Valley. World War II and the Cold War transformed the local economy: Davis-Monthan Air Force Base expanded, and Hughes Aircraft (later Raytheon) opened a missile plant in the 1950s, drawing engineers and technicians from across the country. By 1960, Pima County's population had reached 265,660, still overwhelmingly White and Hispanic, with African Americans comprising less than 3% and almost no Asian presence.
Modern era (post-1965)
The Immigration and Nationality Act of 1965 ended national-origin quotas and reshaped Pima County's demographics, though the effects were slower here than in coastal gateway cities. Mexican immigration continued as the dominant foreign-born stream, with many settling in South Tucson, Drexel Heights, and the Flowing Wells area northwest of Tucson. The 1986 Immigration Reform and Control Act legalized many long-term undocumented residents, solidifying established Mexican-American communities. By 1990, the Hispanic share of the county had risen to roughly 25%, and it has since climbed to 36.1% as of the most recent estimates.
Domestic migration reshaped the county more dramatically than immigration after 1970. Retirees from the Midwest and Northeast discovered Green Valley, a planned retirement community incorporated in 1961 south of Tucson, which grew rapidly through the 1970s and 1980s. Younger families and professionals from California, fleeing high housing costs, began arriving in the 1990s and accelerated after 2000, settling in master-planned suburbs like Oro Valley (northwest of Tucson) and Marana (northwest, along the I-10 corridor). These communities are predominantly White, affluent, and politically conservative, contrasting with Tucson's more liberal, university-oriented core. Sahuarita, south of Tucson, grew from a few hundred residents in 1990 to over 30,000 by 2020, driven by affordable housing and proximity to Raytheon's expanding operations.
East and Southeast Asian communities remain small but have grown steadily, concentrated in Tucson's midtown and near the University of Arizona. Vietnamese refugees arrived after 1975, and a later wave of Chinese, Korean, and Filipino professionals came for tech and academic jobs. The Indian subcontinent population, at 0.6%, is tiny but growing, mostly in tech and medical fields near the university and the Catalina Foothills area. The African American population, at 3.3%, is concentrated in Tucson's central and south-side neighborhoods, with a smaller presence in the suburbs. The foreign-born share, at 5.5%, is well below the national average of roughly 14%, reflecting the county's limited appeal to recent immigrants compared to Phoenix or border cities like Nogales.
The future
Pima County is projected to grow to roughly 1.2 million by 2040, driven primarily by domestic migration from California, the Pacific Northwest, and the Midwest. The Hispanic share will continue rising, likely approaching 45% by 2040, as younger Hispanic families have higher birth rates and continued migration from Mexico and Central America, though the pace of immigration has slowed since 2010. The White non-Hispanic share will decline gradually, but the county will remain majority-White for at least another decade. East/Southeast Asian and Indian populations will grow slowly from a small base, concentrated in professional and academic corridors around the university and the Vail area southeast of Tucson, where new subdivisions are attracting younger families.
The most significant demographic trend is the aging of the population in Green Valley and Oro Valley, where the median age exceeds 50, while Sahuarita and Marana draw younger families with children. This creates a growing divide between retiree-heavy, politically conservative suburbs and the more diverse, younger, and liberal Tucson core. The county's cultural identity is evolving from a simple Anglo-Hispanic binary into a more complex mix, though it remains far less diverse than Phoenix or the national average. Water scarcity and rising housing costs may slow growth in the outer suburbs, while infill development in Tucson's older neighborhoods could accelerate as younger buyers seek walkable, historic areas like Sam Hughes and Armory Park.
For someone moving to Pima County now, the region offers a still-affordable Sun Belt lifestyle with a distinct Southwestern character, but the choice of where to live carries real cultural and political weight. The suburbs lean conservative and family-oriented, while Tucson itself is increasingly liberal, diverse, and university-driven. The county's population is becoming more Hispanic, more educated, and more suburban, but it remains a place where the past — Indigenous, Spanish, Mexican, and Anglo — is still visible in the architecture, the street names, and the annual rodeo and fiesta traditions that define the region's identity.

* Values derived from national, state, county, city and local statistics and may differ in a specific area. Last updated: 2026-07-11T13:23:28.000Z
Narrative content on this page is AI-generated and may contain mistakes. Verify any details that matter before acting on them.
ReloMaps may earn a commission from affiliate links at no extra cost to you.

