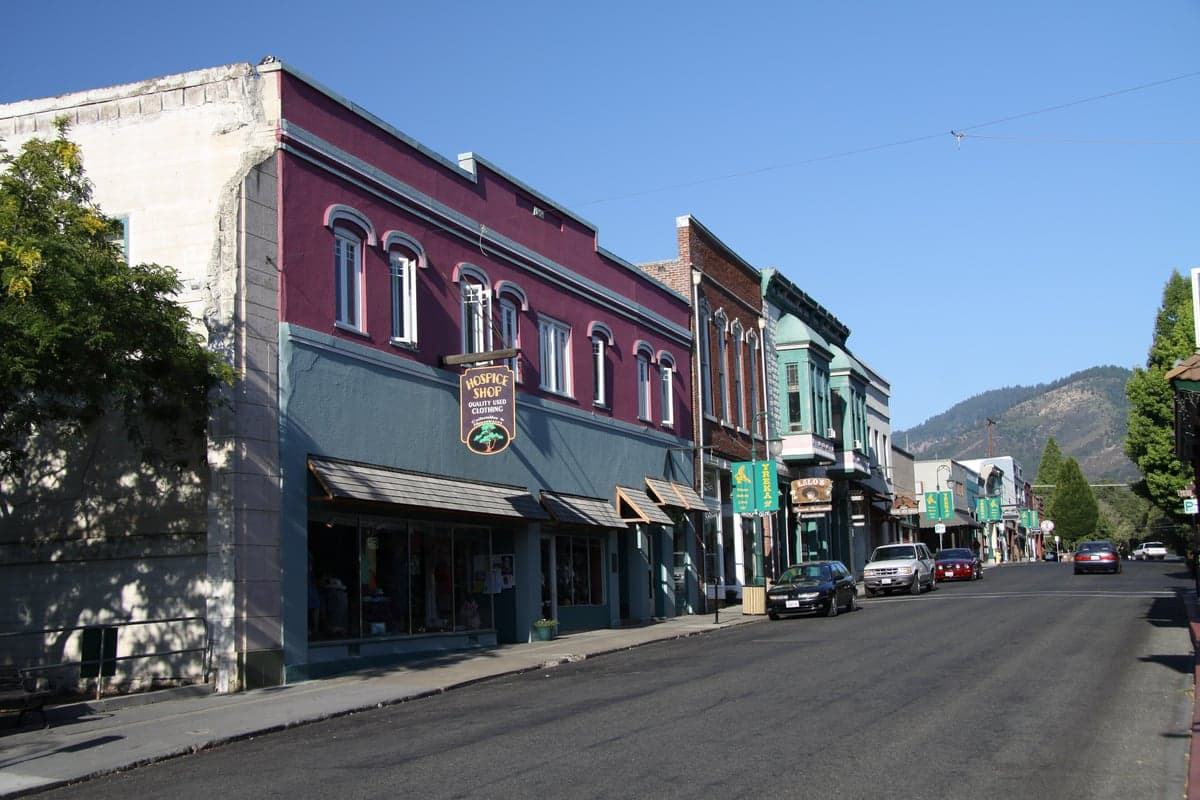
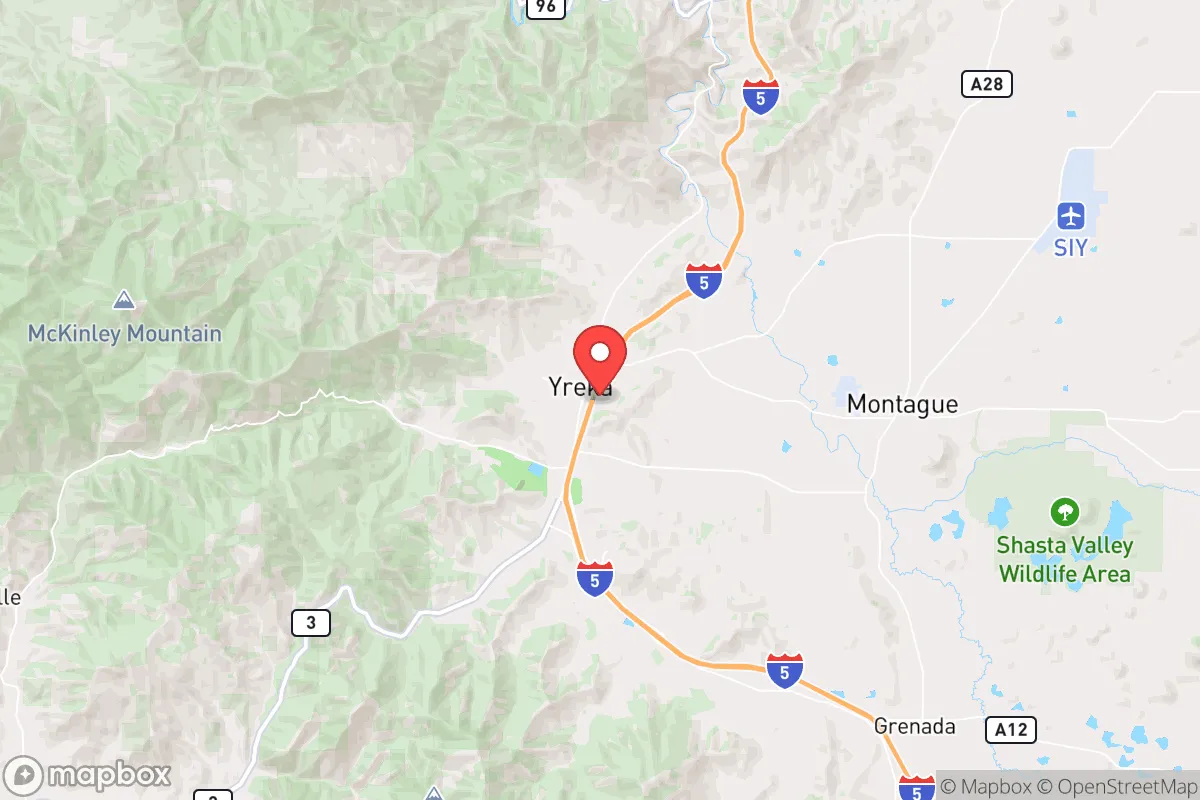
Photo: Wikipedia
Quality of Life in Yreka, CA
A high quality of life with strong walkability, manageable living costs, healthy neighborhood signals, and solid amenity access.
What does Quality of Life tell us?
Quality of Life blends cost of living, nearby amenities, socioeconomic signals, and neighborhood character. City-level scores represent the whole municipality; individual neighborhoods can differ.
What does this tell us?
Quality of Life blends cost of living, nearby amenities, socioeconomic signals, and neighborhood character. City-level scores represent the whole municipality; individual neighborhoods can differ.
Cost of Living
16% below national average
The Real Cost of Living in Yreka, CA for 2026
| Tier | Individual | Family (4) |
|---|---|---|
| Survival | $15k | $29k |
| Comfortable | $48k | $70k |
| Luxury | $77k+ | $119k+ |
| Elite (Top 5%) | $114k+ | $177k+ |
61%
The Area Signal
A metric tracking the socioeconomic signals of the area.
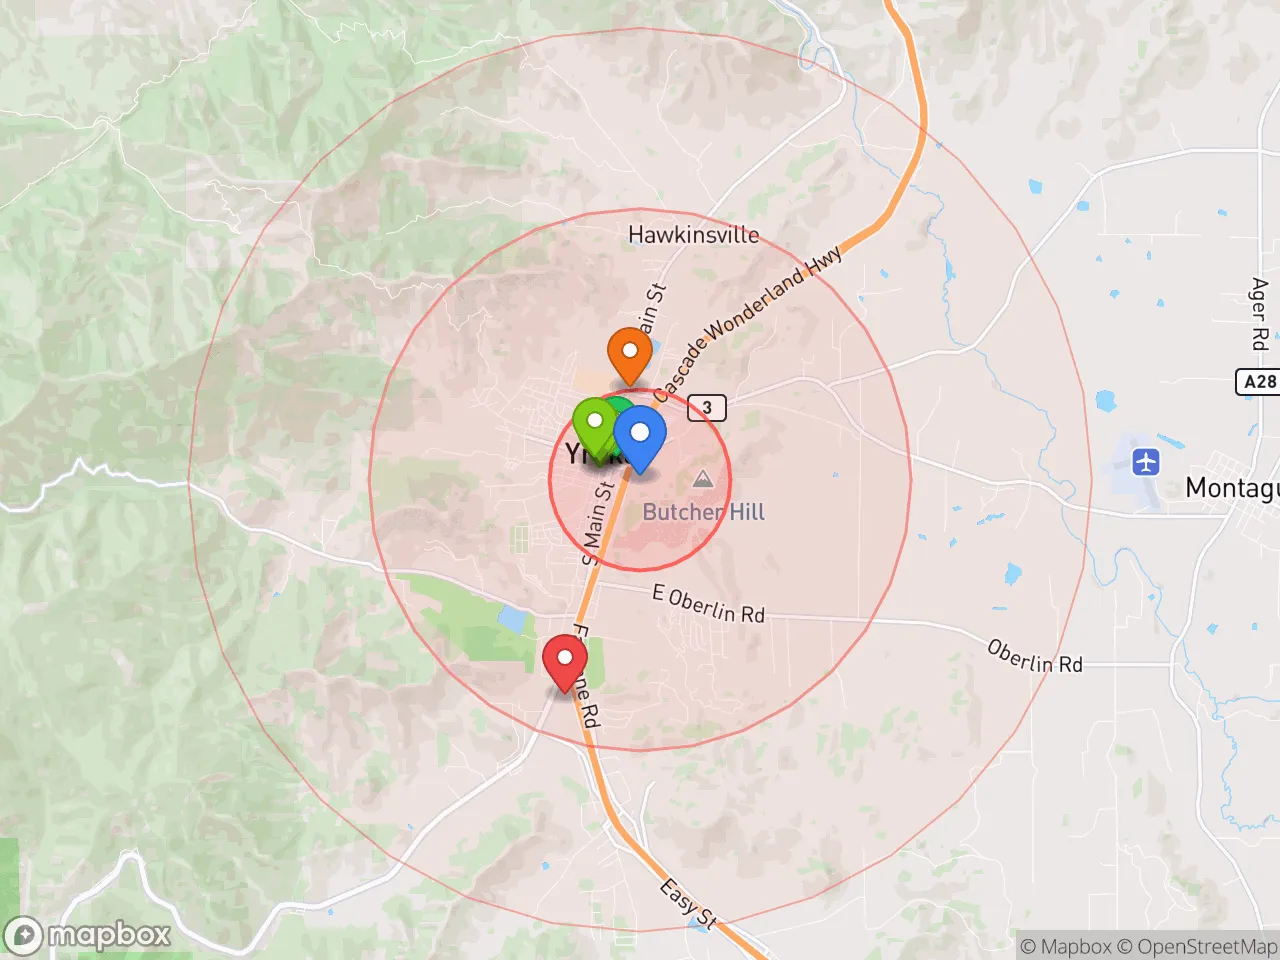
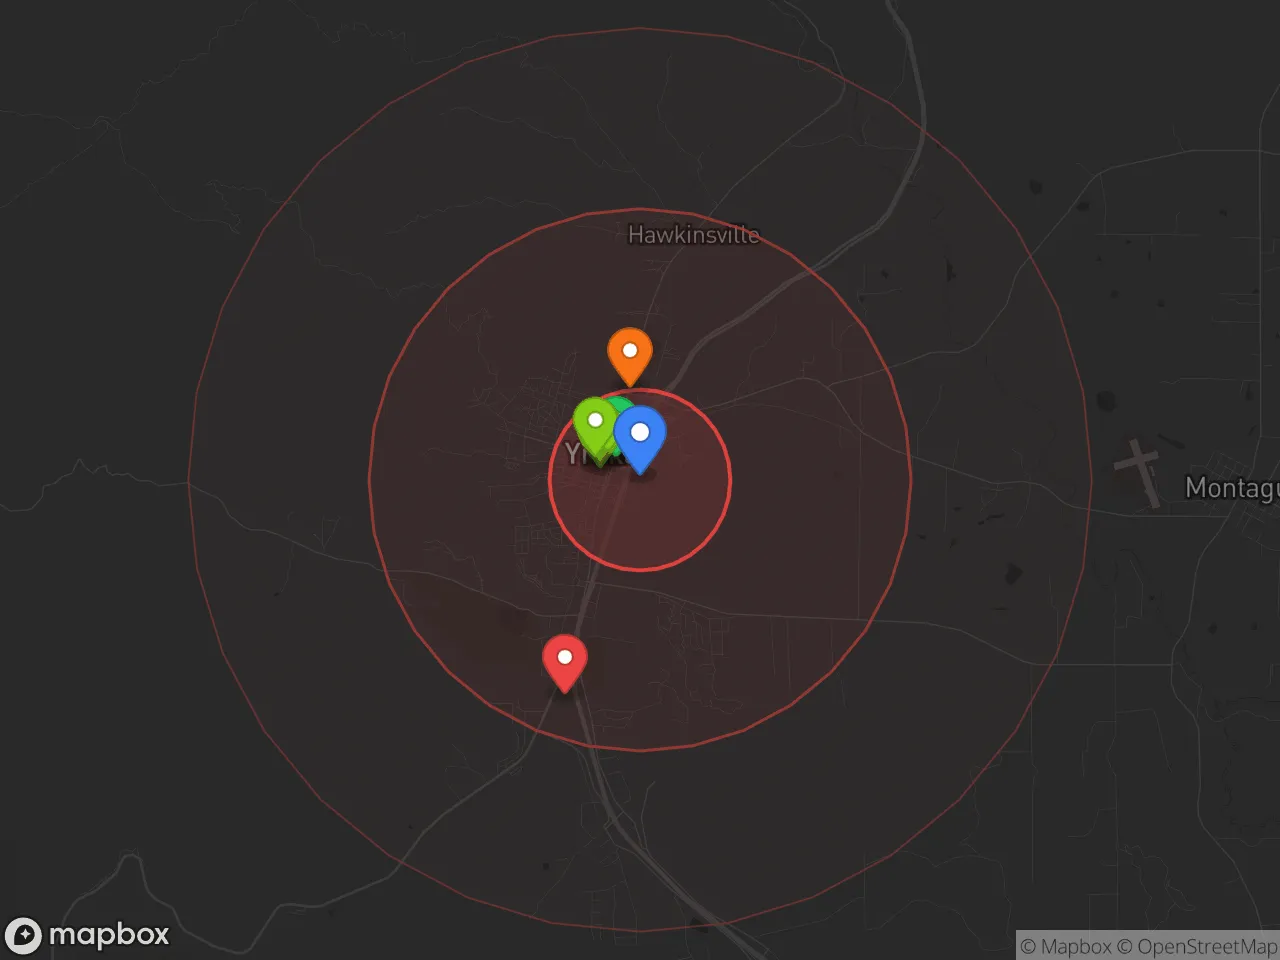
Hobbies
Explore the areaGroceries
0 within 10 miles
Gas
0 within 10 miles
Hospital
0 within 20 miles
Airport
PDX — Portland International
Post Office
Critical Amenities
Quality-of-Life Analysis
Yreka, California, presents a notably affordable quality of life relative to the rest of the state, with a cost of living index of 84 (100 = US average) that draws a mix of retirees, remote workers, and outdoor enthusiasts seeking a slower pace. The population skews older and more conservative than the state average, with a median age around 42 and a strong sense of community rooted in the region's gold rush and railroad history. Median household income hovers near $45,000, reflecting a working-class economy where many residents commute to larger employment hubs like Medford, Oregon, or Mount Shasta for higher-paying jobs.
How affordable is housing in Yreka compared to Mount Shasta or Medford?
Housing in Yreka is significantly cheaper than in nearby mountain towns, with a median home value of $245,100 — roughly half the price of comparable homes in Mount Shasta (where the median exceeds $450,000) and about 30% less than in Medford, Oregon. Median rent sits at $962, making it one of the most budget-friendly rental markets in Siskiyou County. The average commute time of 28.98 minutes is slightly above the national average, largely because many residents drive to jobs in Weed, Mount Shasta, or across the Oregon border. Property taxes remain low by California standards, averaging around 0.7% of assessed value, which further stretches household budgets. However, the trade-off is limited housing inventory — fewer than 50 homes typically list per month — and older housing stock, with many homes built before 1960 requiring updates.
What are the best schools and daily amenities in Yreka?
Yreka Union Elementary School District and Yreka Union High School District serve the area, with Yreka High School earning a 6/10 GreatSchools rating and offering strong vocational programs through the Siskiyou County Office of Education. Daily life revolves around a compact downtown anchored by the historic Yreka Bakery and the Siskiyou County Museum, with grocery shopping limited to a Safeway and Grocery Outlet. For medical care, Fairchild Medical Center provides emergency and primary services, though specialists often require a 45-minute drive to Medford. Outdoor amenities are the standout draw: the Pacific Crest Trail passes 15 miles west, the Klamath River offers Class III–IV rafting, and the Marble Mountain Wilderness provides 250+ miles of hiking trails within a 30-minute drive. The town lacks a movie theater or major chain retailers, so residents typically drive to Medford (45 minutes) for Target, Costco, or multiplex cinemas.
Yreka best suits those who prioritize low housing costs and immediate access to world-class outdoor recreation over urban conveniences or career density. Retirees on fixed incomes, remote workers with stable internet (Spectrum and T-Mobile 5G cover most of town), and seasonal outdoor guides will find the most value here. Families should weigh the limited job market and older school facilities against the safety and community feel — Yreka’s violent crime rate is roughly half the national average. For anyone willing to trade nightlife and shopping for affordable acreage and trout streams, Yreka delivers a quality of life that few California towns under $250,000 can match.

Crime in Yreka, CA
Crime rates similar to the national median for U.S. locations.
Violent CrimeViolent Crime Analysis
Property CrimeProperty Crime Analysis
Crime Analysis
Yreka, California, reports a violent crime rate of 796.7 incidents per 100,000 residents and a property crime rate of 2,141.8 per 100,000, figures that place it among the higher-risk communities in Siskiyou County. While not a large metro area, Yreka’s proximity to the Oregon border and its role as a regional hub for government and commerce mean its safety profile is closely watched by potential movers. The city’s crime statistics reflect challenges common in rural northern California, where limited law enforcement resources and socioeconomic factors intersect.
Crime in context
Yreka’s violent crime rate is roughly double the national average of approximately 380 per 100,000, and its property crime rate exceeds the U.S. median of around 1,950 per 100,000. Compared to California’s statewide violent crime rate of about 440 per 100,000, Yreka’s figure is significantly elevated. The city’s property crime rate, while high, is closer to the state average of roughly 2,200 per 100,000. These numbers place Yreka in a tier with other small northern California towns like Mount Shasta and Weed, though Yreka’s violent crime rate is notably higher than those neighbors. The data suggests that while property crime is a persistent concern, the elevated violent crime rate—driven largely by aggravated assault—is the more distinctive risk factor for residents.
What residents experience
Residents commonly report that property crimes such as vehicle break-ins, theft from yards, and burglary are the most frequent safety issues in daily life. The city’s layout, with residential areas adjacent to commercial corridors and the I-5 freeway, creates opportunities for transient-related crime. Local law enforcement, the Yreka Police Department, maintains a visible presence but operates with a limited force, which can affect response times for non-emergency calls. The broader judicial environment in Siskiyou County, which falls under California’s state-level progressive criminal justice reforms—including Proposition 47 and early release policies—is a point of concern for many residents. These policies, which reduce penalties for certain drug and property offenses, are seen by critics as contributing to repeat offending and a perception that consequences are insufficient to deter crime. Readers moving from areas with more conservative justice systems should be aware that this legal framework may influence how crimes are prosecuted and sentenced in Yreka.
Neighborhood-level variation
Crime in Yreka is not evenly distributed. The downtown core and areas near the Yreka Creek corridor see higher concentrations of police calls, particularly for theft and disorderly conduct. Residential neighborhoods on the city’s east side, closer to the high school and hospital, tend to report fewer violent incidents. The outlying rural areas within the city limits, such as those along Oberlin Road, offer more privacy but also longer emergency response times. Prospective residents are advised to consult the Siskiyou County Sheriff’s Office online crime map and speak with local real estate agents about block-level safety trends, as conditions can vary significantly even within a few blocks.
* Values derived from national, state, county, city and local statistics and may differ in a specific area. Last updated: 2026-10-29T07:39:57.000Z
Narrative content on this page is AI-generated and may contain mistakes. Verify any details that matter before acting on them.
ReloMaps may earn a commission from affiliate links at no extra cost to you.

