Photo: Wikipedia
Demographics of Yreka, CA
Affluence Level in Yreka, CA
A low-income area with significant economic hardship. Household wealth and educational attainment are well below national averages.
People of Yreka, CA
Yreka, California, is a small, predominantly white community of 7,832 residents where a strong sense of frontier heritage and self-reliance defines daily life. The city’s population is notably homogenous, with 76.5% identifying as white and a very low foreign-born rate of 0.6%, reflecting a history of domestic migration rather than international immigration. Hispanic residents make up 13.7% of the population, while Black (1.7%) and East/Southeast Asian (0.2%) communities are very small, and the Indian subcontinent population is effectively zero. With only 19.4% of adults holding a college degree, the city’s identity is rooted in working-class values, outdoor recreation, and a tight-knit, cautious social fabric.
How the city was settled and grew
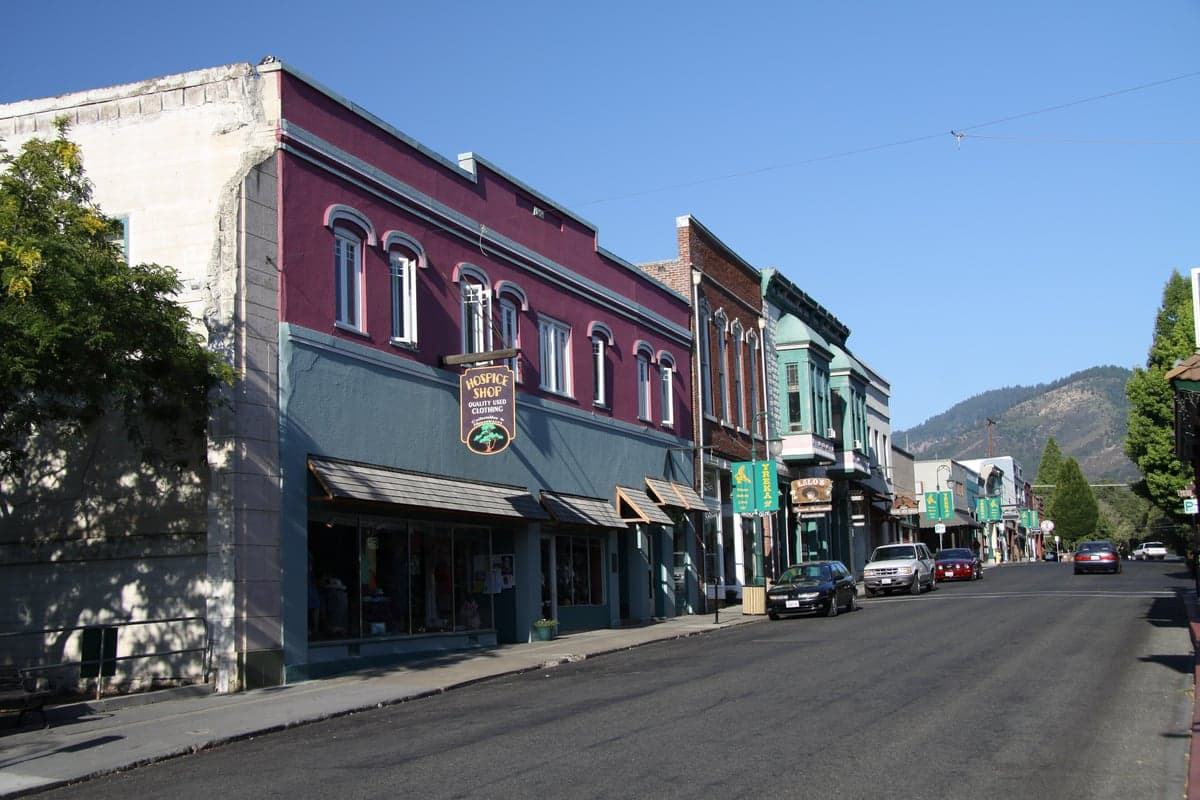
Yreka’s population history begins with the 1851 discovery of gold along the Salmon River, which triggered a rush of white American and European prospectors into the region. The original settlement, known as “Thompson’s Dry Diggings,” was quickly renamed Yreka and became a supply hub for miners. The first significant wave of settlers were predominantly Anglo-American gold seekers from the eastern United States, along with a smaller number of Cornish and Irish miners. These early residents built the historic Gold Street district, where the original brick storefronts still stand, and established the Oregon Street corridor as the town’s commercial spine. By the 1860s, Chinese laborers arrived to work abandoned claims and build the railroad, forming a small Chinatown near the intersection of Miner Street and North Main Street, though this community largely dispersed by the early 1900s. The railroad’s arrival in the 1880s solidified Yreka as a regional trade center for ranching and timber, attracting more white settlers from the Midwest and Pacific Northwest. The Shasta View and Greenhorn Park neighborhoods grew during this era, housing the families of railroad workers and sawmill employees.
Modern era (post-1965)
After the 1965 Immigration Act, Yreka saw virtually no new international immigration, as the city’s remote location and limited economic base offered few pull factors for foreign-born populations. Instead, the modern era has been defined by domestic in-migration of white retirees and remote workers seeking affordable land and a slower pace of life. The Lake Shastina area, a master-planned community just west of Yreka, absorbed many of these newcomers in the 1970s and 1980s, attracting Californians from the Bay Area and Sacramento with its golf course and lake access. Meanwhile, the Hispanic population grew modestly from the 1990s onward, primarily through domestic migration of families from California’s Central Valley and from other parts of Siskiyou County, settling in the South Yreka neighborhoods near the fairgrounds and along Fort Jones Road. This group now makes up 13.7% of the population, concentrated in lower-cost rental housing and mobile home parks. The Black population (1.7%) remains small and dispersed, with no distinct neighborhood concentration, while the East/Southeast Asian community (0.2%) is largely limited to a handful of families in the College Heights area near the College of the Siskiyous campus. The city’s college-educated share (19.4%) is well below the national average, reflecting an economy still anchored in government services, healthcare, and retail rather than knowledge industries.
The future
Yreka’s population is projected to remain stable or decline slightly over the next decade, as the region’s aging white population (median age 46) is not being replaced by younger families. The Hispanic share is expected to grow gradually, potentially reaching 18-20% by 2040, as families from the Central Valley continue to seek lower housing costs, but this growth will likely remain concentrated in the South Yreka and Fort Jones Road corridors. The city’s cultural identity is slowly shifting from a purely Anglo-frontier character to a more bicultural one, though the pace is slow enough that most newcomers will still find a predominantly white, conservative community. The lack of new housing construction and the limited job base in sectors like tech or manufacturing mean that Yreka will not attract significant diversity from outside the region. For a family moving in now, the city offers a stable, low-crime environment where neighbors know each other, but the demographic trajectory points toward continued homogeneity and a slow, aging population.
For someone relocating to Yreka today, the city is best understood as a quiet, historically white working-class town that is gradually becoming more Hispanic but remains far less diverse than most of California. The community’s strength lies in its social cohesion and low cost of living, but newcomers should expect a population that is older, less formally educated, and more culturally insular than the state average. The next 20 years will likely see Yreka become slightly more bilingual and bicultural, but it will remain a place where the frontier past still shapes daily life.

* Values derived from national, state, county, city and local statistics and may differ in a specific area. Last updated: 2026-10-29T07:39:57.000Z
Narrative content on this page is AI-generated and may contain mistakes. Verify any details that matter before acting on them.
ReloMaps may earn a commission from affiliate links at no extra cost to you.

