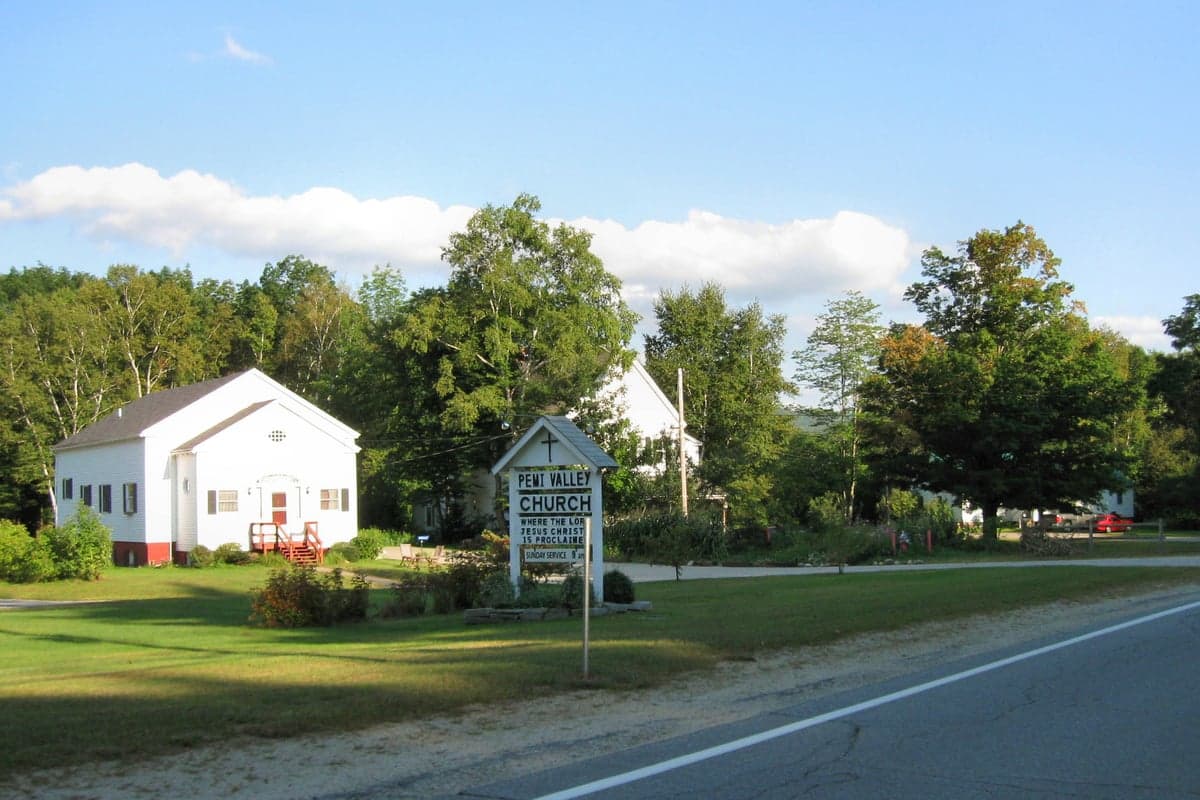
Photo: Wikipedia
Quality of Life in Woodstock, NH
Above-average quality of iife. The area offers a reasonable cost of living, decent mobility, and a mix of neighborhood amenities.
What does Quality of Life tell us?
Quality of Life blends cost of living, nearby amenities, socioeconomic signals, and neighborhood character. City-level scores represent the whole municipality; individual neighborhoods can differ.
What does this tell us?
Quality of Life blends cost of living, nearby amenities, socioeconomic signals, and neighborhood character. City-level scores represent the whole municipality; individual neighborhoods can differ.
Cost of Living
7% below national average
The Real Cost of Living in Woodstock, NH for 2026
| Tier | Individual | Family (4) |
|---|---|---|
| Survival | $17k | $31k |
| Comfortable | $54k | $79k |
| Luxury | $121k+ | $188k+ |
| Elite (Top 5%) | $181k+ | $281k+ |
85%
The Area Signal
A metric tracking the socioeconomic signals of the area.
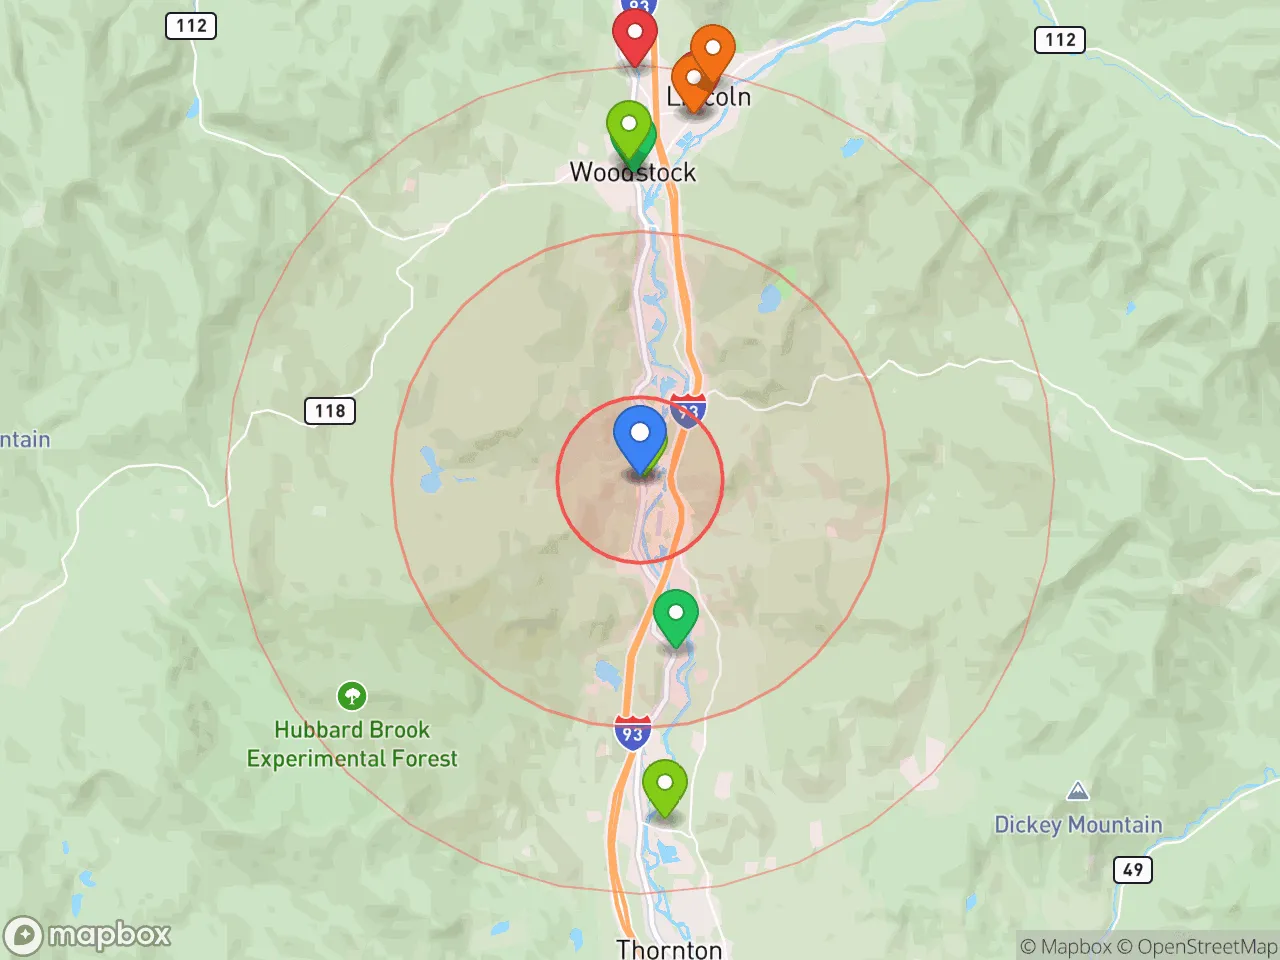
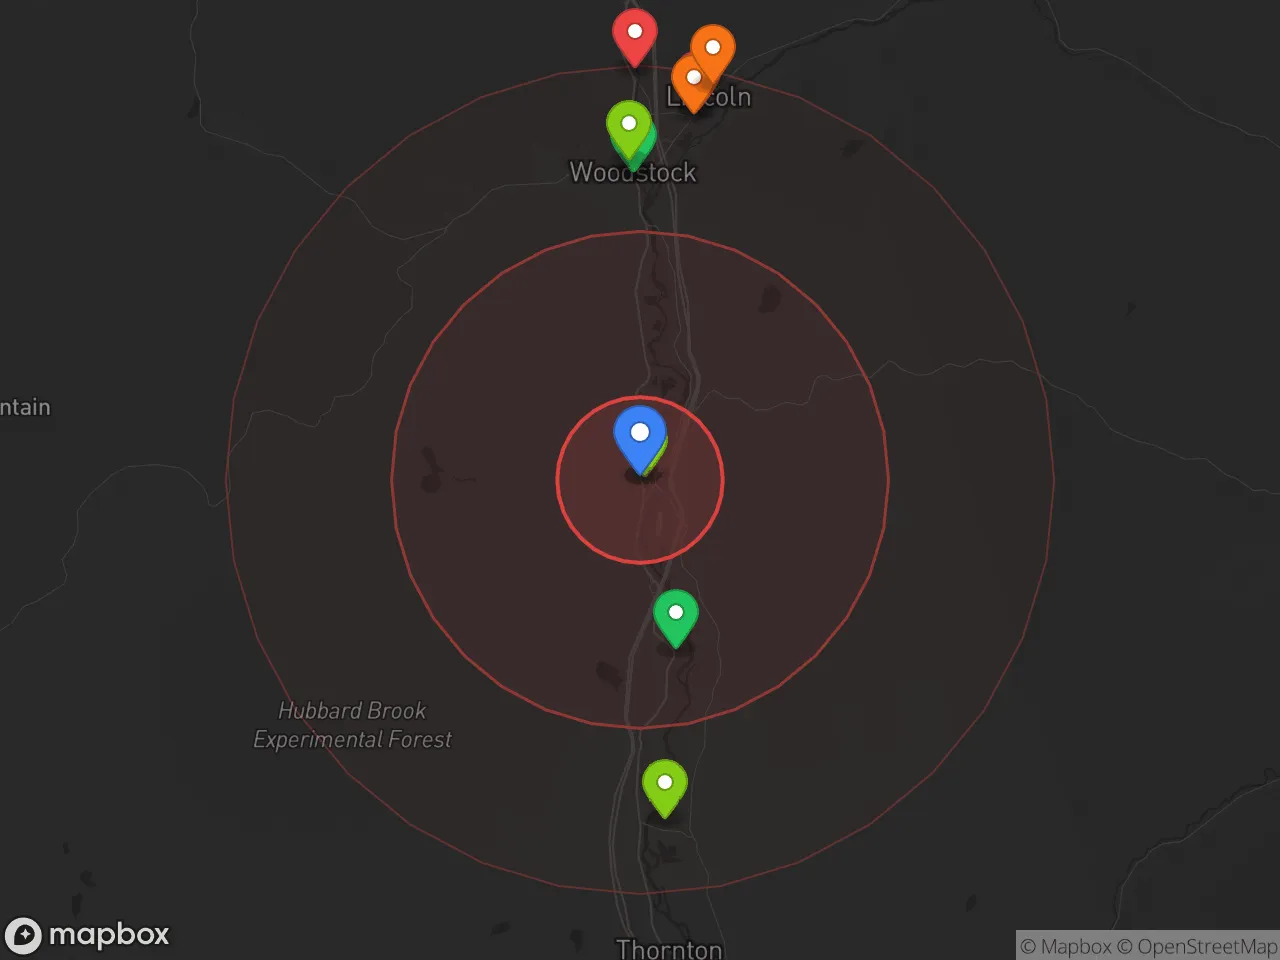
Hobbies
Explore the areaGroceries
0 within 10 miles
Gas
0 within 10 miles
Hospital
0 within 20 miles
Airport
PDX — Portland International Jetport
Post Office
Critical Amenities
Quality-of-Life Analysis
Woodstock, New Hampshire, presents a quality-of-life profile that is quietly affluent rather than ostentrally wealthy, with a cost of living index of 93 (about 7% below the U.S. average) that attracts a mix of remote professionals, second-home owners, and long-established Granite State families. The town’s demographic skews toward college-educated residents who value outdoor access, small-school intimacy, and a slower daily rhythm than the nearby Lakes Region tourist hubs. Median home values of $275,500 and median rents of $1,038 place Woodstock as a middle-to-upper-middle-class enclave where housing remains attainable compared to Lincoln or North Conway, yet still commands a premium over more rural Grafton County towns.
How housing costs and affordability compare to Lincoln, Plymouth, and the broader White Mountains
Woodstock’s median home value of $275,500 sits roughly 15–20% below Lincoln’s median (which frequently exceeds $330,000 due to ski-adjacent condos and short-term rental demand) but about 10% above Plymouth’s more modest stock. Renters fare well: the median rent of $1,038 is notably cheaper than the $1,400+ typical for a two-bedroom in Lincoln or North Conway, making Woodstock a pragmatic choice for service workers and young families priced out of the resort corridor. Property taxes in Woodstock run near the state median of roughly $20 per $1,000 of assessed value, which translates to an annual bill around $5,500 on an average-priced home — a meaningful line item, but offset by New Hampshire’s lack of state income tax and sales tax. The affordability gap with nearby areas is most visible in the rental market: a renter earning the county median household income of about $68,000 would spend just 18% of gross income on rent, versus closer to 25% in Lincoln.
What daily life is like for families, remote workers, and outdoor enthusiasts
Daily life in Woodstock revolves around the Pemigewasset River valley, the Appalachian Trail, and the town’s position as a quieter bedroom community to Lincoln’s Loon Mountain and Cannon Mountain resorts. The local school system — Woodstock Elementary School feeding into Lin-Wood Public School (a combined SAU with Lincoln) — serves roughly 500 students district-wide, with class sizes averaging 12–15 and a graduation rate near 90%. Amenities are deliberately modest: a small general store, the Woodstock Inn Brewery, and the Ice House Tavern anchor the commercial core, while most shopping and medical needs require a 15-minute drive to Plymouth (home to Speare Memorial Hospital) or a 25-minute drive to Littleton. The average commute of 23.2 minutes reflects a workforce split between Plymouth’s Plymouth State University and healthcare employers, Lincoln’s hospitality sector, and a growing cohort of remote workers who prize the town’s gigabit fiber internet — available through the NH FastRoads initiative — over urban convenience. Winters bring snow removal as a shared civic ritual, while summers see a modest influx of hikers and kayakers that never reaches the congestion of Franconia Notch.
Woodstock is best suited for those who see the White Mountains as a lifestyle asset rather than a weekend getaway — families wanting small schools and low crime, remote workers who can trade a longer drive for a quieter home office, and retirees seeking four-season recreation without resort-town pricing. The town’s affordability relative to Lincoln, combined with its 23-minute commute to Plymouth’s jobs and services, makes it a rational choice for buyers who want mountain access without the premium of a ski-in/ski-out address. Those seeking nightlife, cultural density, or a walkable downtown will find Woodstock too quiet; those seeking a base camp for hiking, skiing, and river swimming — with housing costs 7% below the national average — will find it close to ideal.

Crime in Woodstock, NH
Lower crime rates than 98% of comparable U.S. locations.
Violent CrimeViolent Crime Analysis
Property CrimeProperty Crime Analysis
Crime Analysis
Woodstock, New Hampshire, is one of the safest communities in the state, with a violent crime rate of 0 per 100,000 residents and a property crime rate of 276.1 per 100,000. These figures place Woodstock far below both the New Hampshire state averages and national benchmarks, reflecting a rural environment where serious crime is virtually nonexistent. The town’s location in Grafton County, away from the higher-crime corridors of the Seacoast and Manchester, further reinforces its reputation as a low-risk area for families, retirees, and second-home owners.
Crime in context
Woodstock’s violent crime rate of zero is statistically exceptional, even for a small New England town. By comparison, the national violent crime rate in 2023 was approximately 380 per 100,000, meaning Woodstock residents face essentially no risk of homicide, assault, robbery, or sexual assault within town limits. Property crime in Woodstock, at 276.1 per 100,000, is roughly one-third the national average of about 800 per 100,000 and well below the New Hampshire state average of approximately 1,100 per 100,000. The most common property incidents are thefts from unlocked vehicles and occasional burglaries of seasonal camps, rather than organized or violent property crime. These low numbers are consistent with the broader pattern across New Hampshire’s White Mountain region, where isolation and community vigilance keep crime minimal.
What residents experience
Daily life in Woodstock is characterized by a strong sense of security. Residents routinely leave doors unlocked during the day, children walk to the local elementary school without concern, and the town’s police department—staffed by a mix of full-time and part-time officers—focuses on traffic safety and community engagement rather than serious crime response. The town’s economy, centered on tourism to the nearby Loon Mountain ski resort and the Pemigewasset River recreation area, does bring seasonal crowds, but this has not translated into elevated crime rates. No neighborhood in Woodstock has a statistically higher crime rate than another, as the entire town benefits from low population density and strong social cohesion. The most significant public safety issue is the occasional winter storm or vehicle accident on Interstate 93, which runs through the town’s eastern edge.
For those considering relocation, Woodstock’s crime data presents a clear picture: it is one of the safest places in New Hampshire, with no violent crime and property crime rates that are a fraction of state and national averages. The town’s justice system, operating under New Hampshire’s conservative-leaning judiciary, does not exhibit the progressive prosecutorial policies seen in larger metropolitan areas—a factor that contributes to the low recidivism and high public confidence residents report. While no community is entirely crime-free, Woodstock’s numbers and lived experience align to make it a top-tier choice for safety-conscious homebuyers.
* Values derived from national, state, county, city and local statistics and may differ in a specific area. Last updated: 2026-10-20T07:45:58.000Z
Narrative content on this page is AI-generated and may contain mistakes. Verify any details that matter before acting on them.
ReloMaps may earn a commission from affiliate links at no extra cost to you.

