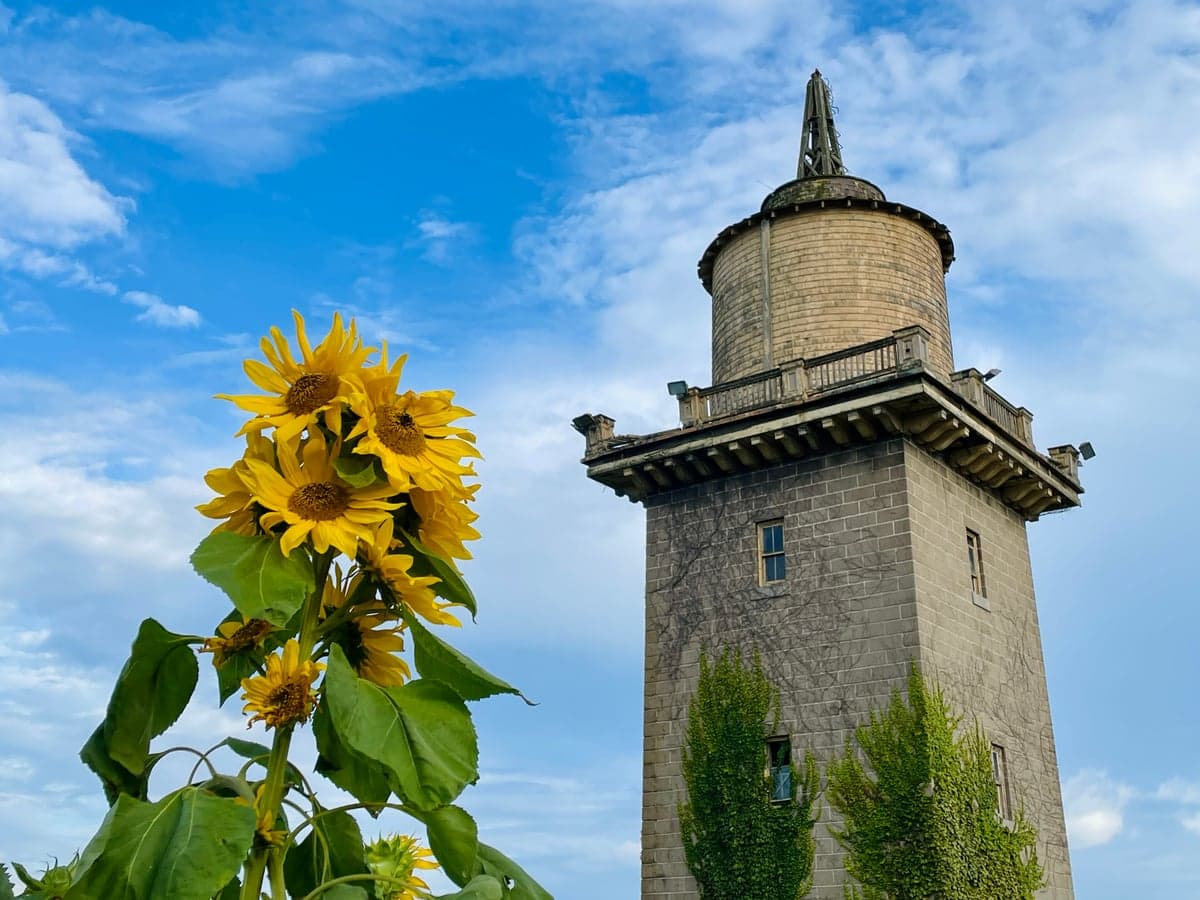
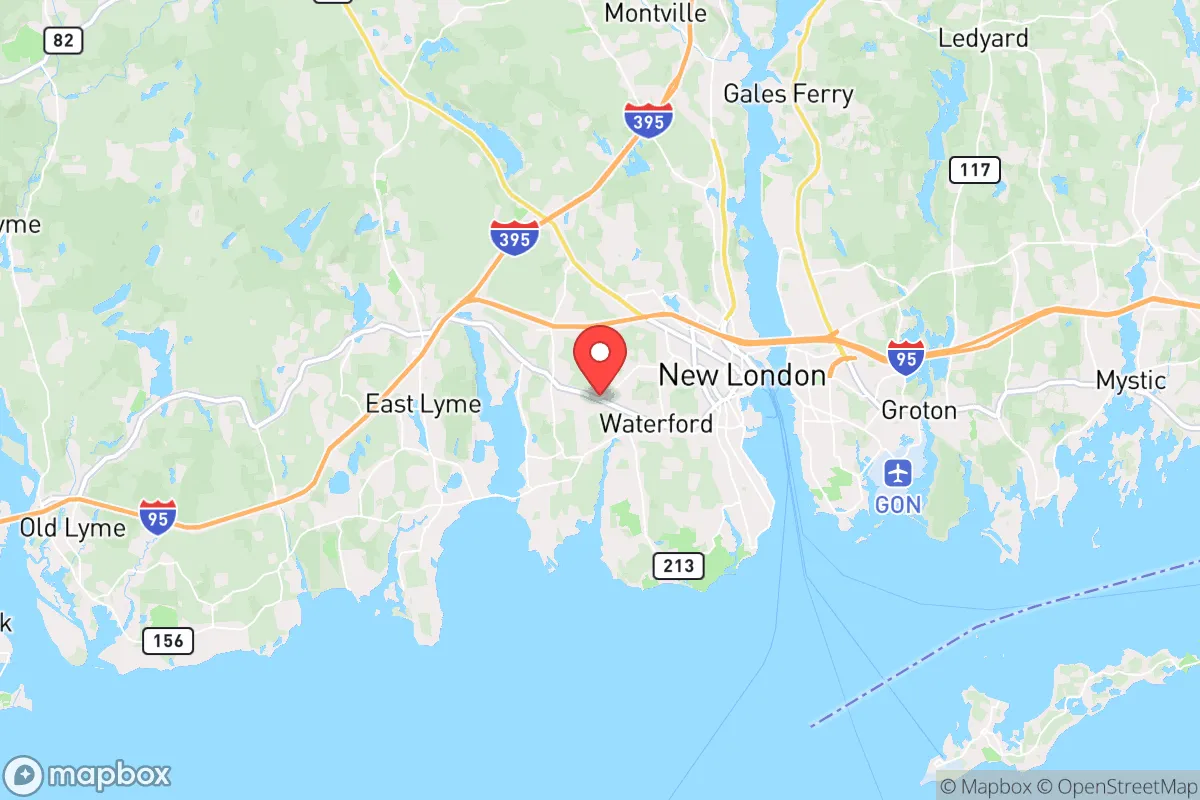
Photo: Wikipedia
Demographics of Waterford, CT
Affluence Level in Waterford, CT
A middle-class area roughly in line with national averages across income, home values, education, and employment.
People of Waterford, CT
Waterford, Connecticut, is a small, predominantly white coastal community of 3,496 residents, where a quiet, family-oriented character prevails. With a foreign-born population of just 1.4%, the city is notably less diverse than the state average, though modest Hispanic (8.2%) and Black (8.0%) communities have established roots. The population is older and less college-educated (25.5%) than many neighboring towns, reflecting a stable, long-settled demographic that values its historic New England identity and access to the shoreline.
How the city was settled and grew
Waterford’s original population was drawn by the land itself. English colonists from the Massachusetts Bay Colony and eastern Connecticut settled the area in the mid-17th century, drawn by the fertile coastal plain and the sheltered harbor at the mouth of the Niantic River. The town was officially incorporated in 1801 from parts of New London, and its early economy revolved around shipbuilding, fishing, and small-scale farming. The historic Jordan Village neighborhood, centered on the town’s original green, became the heart of this early English settlement, with its white clapboard houses and Congregational church. A second wave of growth came in the late 19th and early 20th centuries, when the arrival of the railroad and the establishment of summer resorts along the shore brought Irish and Italian immigrant laborers. These groups settled primarily in the Millstone Point and Pleasant Valley areas, working in the granite quarries and on the railroad line. By the mid-20th century, Waterford remained a small, overwhelmingly white, working-class town, with a population that had grown slowly but steadily.
Modern era (post-1965)
The post-1965 era brought only modest demographic change to Waterford, largely because the town lacked the industrial or service-sector job growth that attracted immigrants to larger cities. The most significant shift was domestic: the construction of Interstate 95 in the 1960s made Waterford a commuter suburb for New London and Groton, drawing middle-class families from those cities. This suburbanization concentrated in newer subdivisions like Great Neck and Quaker Hill, where single-family homes on larger lots replaced farmland. The Hispanic population, now 8.2%, began to grow in the 1990s, with families settling in the Route 85 corridor near the New London border, drawn by lower housing costs and proximity to service-sector jobs. The Black population (8.0%) is largely concentrated in the same area, reflecting a pattern of modest, organic integration rather than large-scale migration. The Indian subcontinent community (2.1%) is a very recent arrival, primarily professionals working at the nearby Pfizer and Electric Boat facilities, and they are dispersed rather than clustered in a single neighborhood. East/Southeast Asian residents (0.9%) are similarly scattered. Overall, Waterford’s modern era has been one of slow, incremental diversification, with the white share declining from roughly 95% in 1980 to 75.2% today, but the pace of change remains far slower than in Connecticut’s larger cities.
The future
Waterford’s population is projected to remain stable or decline slightly over the next decade, as the town’s older housing stock and limited rental inventory attract fewer young families. The white population will continue its gradual decline, but the pace of diversification is unlikely to accelerate dramatically. The Hispanic and Black shares may each rise to around 10-12% by 2040, driven by natural increase and modest in-migration from New London. The Indian subcontinent community, while small, is the fastest-growing group, likely to reach 3-4% as the nearby submarine and pharmaceutical sectors expand. These new residents are expected to continue dispersing across the town rather than forming ethnic enclaves, given Waterford’s small size and single-family-home character. The cultural identity of the town is evolving slowly: the old Yankee and Irish-Catholic foundations remain strong, but the annual Niantic Bay Festival and the growing number of Hispanic-owned businesses along Route 85 signal a more layered community. For a newcomer, Waterford offers a stable, safe, and historically rooted environment where change comes gradually, and where the population’s character remains defined more by its coastal New England heritage than by rapid demographic turnover.
For someone moving in now, Waterford is a place where the past still shapes the present. The population is aging, modestly diversifying, and deeply attached to its small-town identity. The trade-off is clear: a quiet, low-crime community with strong schools and access to the shore, but limited cultural diversity and a slower pace of change than many suburbs closer to Hartford or New Haven. It is best suited for families and retirees who value stability over vibrancy, and who are comfortable in a community where the majority of residents have deep, multi-generational roots.

* Values derived from national, state, county, city and local statistics and may differ in a specific area. Last updated: 2026-09-18T03:55:44.000Z
Narrative content on this page is AI-generated and may contain mistakes. Verify any details that matter before acting on them.
ReloMaps may earn a commission from affiliate links at no extra cost to you.

