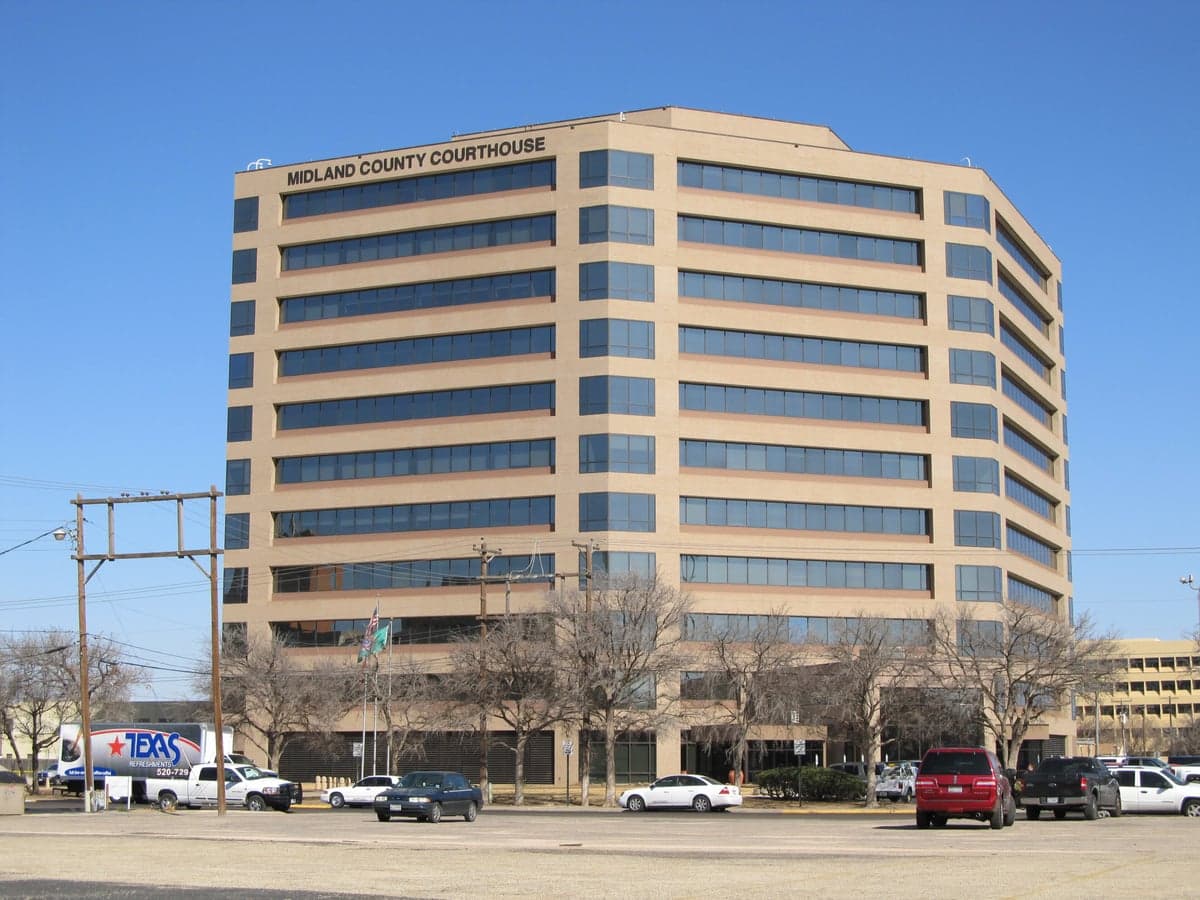
Photo: Wikipedia
Demographics of Midland County
Affluence Level in Midland County
A middle-class area roughly in line with national averages across income, home values, education, and employment.
People of Midland County
Midland County, Texas, is home to 171,496 people, a population shaped overwhelmingly by the oil and gas industry. The county is defined by a stark demographic duality: a 44.0% White, largely Anglo population and a 44.8% Hispanic population, with a small but growing 6.4% Black community and 1.8% East/Southeast Asian residents. The foreign-born share sits at 7.1%, and 30.9% of adults hold a college degree. The county's identity is rooted in boom-and-bust cycles, producing a transient, high-income workforce that coexists with deep-rooted Tejano and ranching families.
Settlement & growth (pre-1960)
Before Anglo-American settlement, the area now known as Midland County was part of the vast Comanchería, the domain of the Comanche people, who dominated the Southern Plains through the 18th and early 19th centuries. Spanish and Mexican expeditions passed through but established no permanent settlements. The region remained a sparsely populated frontier until after the Texas Annexation in 1845 and the subsequent defeat of the Comanche in the 1870s.
The first permanent Anglo settlers arrived in the 1880s, drawn by the Texas and Pacific Railway, which established a depot at what is now Midland in 1881. The town was named for its location midway between Fort Worth and El Paso. These early settlers were primarily cattle ranchers from the American South and Midwest, taking advantage of the vast open range. The county was officially organized in 1885, and Midland became the county seat. For the next four decades, the economy was almost entirely agricultural, with a small, stable population of ranchers and farmers.
Everything changed with the discovery of the Permian Basin oil field in the 1920s. The 1923 discovery of oil in nearby Mitchell County triggered a massive influx of fortune seekers, roughnecks, and oil-field workers. This was the first major population boom. The new arrivals were overwhelmingly White, native-born Americans from the South and Midwest—many from Oklahoma, Arkansas, and East Texas. Midland transformed from a ranching town into an oil-boom hub almost overnight. The population surged from 2,192 in 1920 to 9,684 in 1930. The Dust Bowl of the 1930s pushed additional "Okies" and "Arkies" into the county, seeking work in the oil fields. A smaller number of Black workers also arrived during this period, settling in the segregated neighborhoods of west Midland, but the Black population remained a small fraction of the total.
By the 1950s, Midland had established itself as the administrative and corporate headquarters of the Permian Basin. The population grew steadily, reaching 67,717 by 1960. This era saw the arrival of a more professional class—geologists, petroleum engineers, and corporate executives—who built the city's affluent west side. The Hispanic population, which had been present since the county's founding as a small Tejano community, began to grow more rapidly as oil-field labor demands attracted workers from the Rio Grande Valley and Mexico. These families concentrated in the south and east sides of Midland, particularly around the historic South Midland neighborhood.
Modern era (post-1965)
The 1965 Hart-Cellar Act had a limited direct impact on Midland County compared to major metropolitan areas, but it did open the door for a small wave of immigrants. The most notable post-1965 immigrant group has been East/Southeast Asian professionals, primarily from India and the Philippines, recruited by the oil and gas industry for engineering and technical roles. These families settled in the affluent west Midland neighborhoods and the newer subdivisions near the Midland International Air & Space Port. The East/Southeast Asian population now stands at 1.8%, and the Indian-subcontinent population at 0.3%—small but highly educated and concentrated in the energy sector.
The dominant demographic story of the modern era, however, has been the rapid growth of the Hispanic population. Driven by both immigration from Mexico and high birth rates among established Tejano families, the Hispanic share rose from roughly 15% in 1970 to 44.8% today. This growth has been concentrated in south Midland, east Midland, and the unincorporated community of Greenwood, a small settlement southeast of the city that has become a predominantly Hispanic working-class enclave. The Hispanic population is now roughly equal in size to the White population, a shift that has reshaped local politics, schools, and culture.
The domestic migration story is one of boom-and-bust cycles tied to oil prices. The 1970s oil crisis brought a massive influx of workers from the Rust Belt and other energy states, pushing the county population to a then-peak of 82,636 in 1980. The 1980s oil bust caused a sharp exodus, with the population dropping to 106,611 by 1990. The most recent boom, driven by hydraulic fracturing in the 2010s, brought a new wave of domestic migrants—young, male, and predominantly White—from Texas, Oklahoma, Louisiana, and North Dakota. These workers often live in temporary housing, man camps, and apartments in west Midland and the newer developments along Highway 191. The Black population, at 6.4%, has remained relatively stable, concentrated in the historic west Midland neighborhoods near the old segregated district.
The future
Midland County is projected to become more Hispanic and slightly more diverse over the next 10-20 years. The White population share is declining gradually as the Anglo population ages and younger Hispanic families have more children. The Hispanic share is expected to become the majority within the next decade, likely reaching 50-55% by 2040. The East/Southeast Asian and Indian populations are expected to grow modestly, driven by continued recruitment of energy-sector professionals, but will remain small single-digit shares. The Black population is likely to remain stable or grow slowly, as the oil industry does not attract large numbers of Black domestic migrants.
Geographically, the future will see continued expansion of the suburban fringe. New master-planned communities are emerging along the Highway 191 corridor west of Midland, attracting affluent White and Asian families. The south and east sides will continue to be predominantly Hispanic, with Greenwood and the unincorporated areas near Midland's city limits absorbing much of the working-class growth. The county's cultural identity is evolving from a historically Anglo, conservative oil town into a bilingual, bicultural community where Hispanic traditions—from quinceañeras to local Mexican restaurants—are becoming mainstream. The political landscape, long dominated by conservative White voters, is beginning to shift as the Hispanic electorate grows, though the county remains reliably Republican.
For someone moving in now, Midland County is a place of stark contrasts: high incomes and high housing costs, a transient oil-field workforce and deep-rooted Tejano families, a booming economy and a boom-and-bust vulnerability. The county is becoming more Hispanic, more suburban, and more economically stratified. New arrivals will find a community that is welcoming to those in the energy industry but less so to outsiders in other sectors, and a social fabric that is increasingly defined by the interaction between its two largest ethnic groups.

* Values derived from national, state, county, city and local statistics and may differ in a specific area. Last updated: 2026-07-05T22:49:16.000Z
Narrative content on this page is AI-generated and may contain mistakes. Verify any details that matter before acting on them.
ReloMaps may earn a commission from affiliate links at no extra cost to you.

