Photo: Wikipedia
Demographics of Romney, WV
Affluence Level in Romney, WV
A below-average socioeconomic profile. Incomes, home values, and educational attainment trail the U.S., with higher poverty and unemployment.
People of Romney, WV
The people of Romney, West Virginia, today form a small, tightly-knit community of 1,714 residents characterized by its overwhelming racial homogeneity and deep local roots. With 90.1% of the population identifying as White, a Black population of 2.0%, and negligible shares of Hispanic (0.5%), Asian (0.0%), and Indian (0.0%) residents, Romney is one of the least diverse small cities in the Eastern Panhandle. The foreign-born population sits at just 0.2%, reinforcing a community identity shaped by generations of families who have lived in Hampshire County for decades, with a strong sense of place and a conservative, self-reliant cultural outlook.
How the city was settled and grew
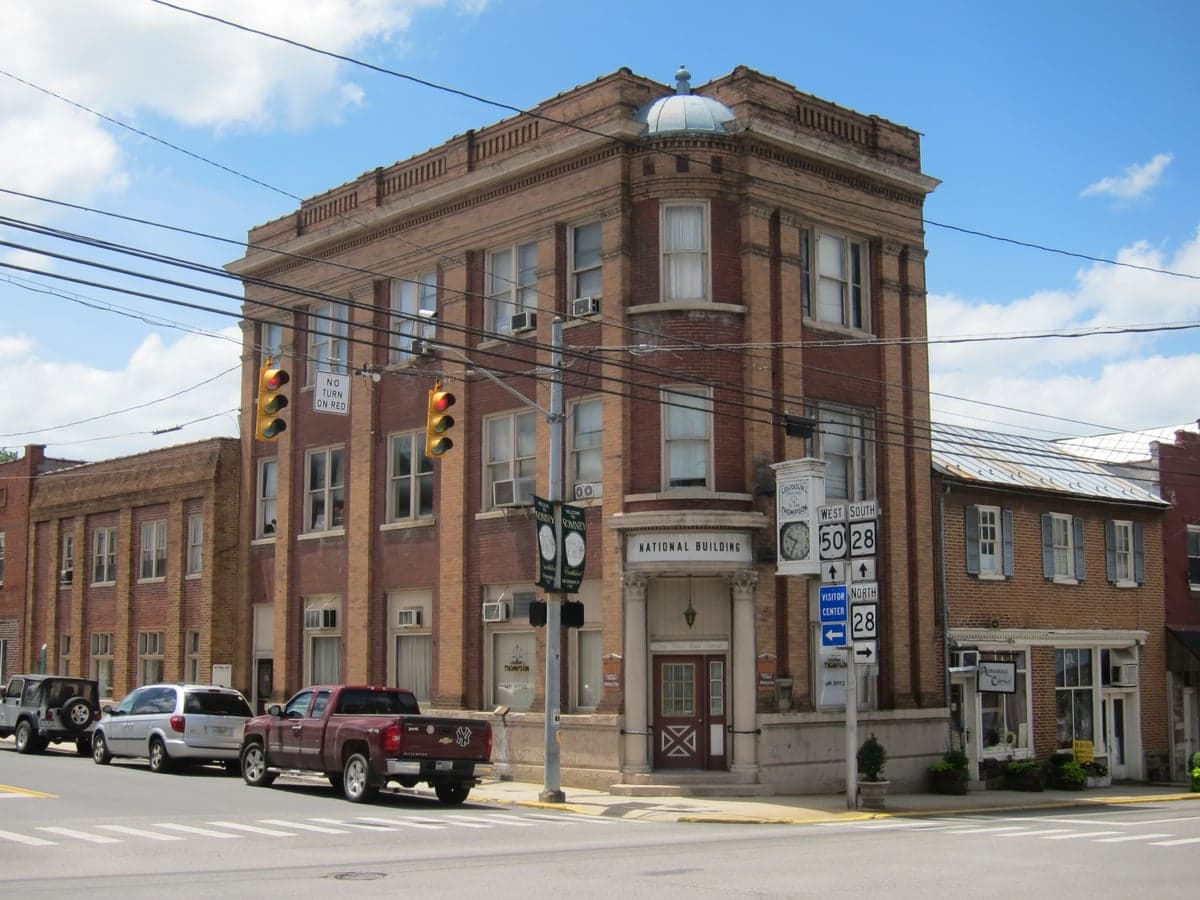
Romney’s human history begins with its founding in 1762, making it the oldest town in West Virginia. The original settlers were primarily English, Scots-Irish, and German farmers drawn by the fertile bottomlands of the South Branch Potomac River and land grants issued under Lord Fairfax’s Northern Neck Proprietary. These early families—names like Pugh, Blue, and Pancake—established homesteads in what is now Historic Downtown Romney, centered around the courthouse square, and along the river terraces of South Branch Valley. The town’s role as the Hampshire County seat anchored a population of merchants, lawyers, and tradesmen, but agriculture remained the economic backbone through the 19th century. The arrival of the South Branch Railroad in the 1880s brought a modest wave of Irish and German laborers who settled in Railroad District, a working-class area near the depot. By 1900, Romney’s population had reached roughly 1,000, and it remained a predominantly White, Protestant community with little ethnic variation through the mid-20th century.
Modern era (post-1965)
After the 1965 Hart-Cellar Act, Romney experienced virtually no immigration-driven diversification. The 0.2% foreign-born figure today reflects a town that has not been a destination for international migration. Instead, the modern era has been defined by domestic in-migration from other parts of West Virginia and neighboring states, particularly Maryland and Virginia. The construction of Romney Fields, a residential subdivision developed in the 1990s and 2000s on the town’s eastern edge, attracted younger families seeking affordable housing within commuting distance of Winchester, Virginia (about 30 miles east). These newcomers are overwhelmingly White and tend to be slightly more educated than the town average, though Romney’s college attainment rate remains low at 14.7%. The Black population, at 2.0%, is concentrated in older neighborhoods like West Romney, near the former segregated school sites, reflecting historical settlement patterns rather than recent migration. The Hispanic and Asian populations are statistically negligible, and no identifiable ethnic enclaves exist. Romney’s demographic story in the post-1965 period is one of stability, not transformation.
The future
Romney’s population trajectory points toward continued homogeneity and slow, if any, growth. The town’s population has hovered around 1,700–1,800 for decades, and projections suggest little change through 2040. The primary demographic shift will likely be aging: the median age in Hampshire County is 44.5, well above the national median, and Romney mirrors that trend. Younger families moving into Romney Fields and newer subdivisions like Mill Creek Estates (a small development on the town’s north side) may slightly lower the median age, but these are modest infill movements, not large-scale migration. The town’s cultural identity—rooted in local churches, the Hampshire County Fair, and a strong hunting-and-outdoors tradition—is unlikely to evolve significantly. Diversity will remain minimal; the 0.5% Hispanic share and 2.0% Black share are not expected to rise meaningfully given the lack of economic pull factors or affordable housing stock for new arrivals. For a prospective resident, this means moving into a community where social networks are long-established and newcomers are welcomed but expected to adapt to existing norms.
Romney is becoming a quieter, older version of itself—a place where demographic change is measured in single percentage points over decades. For someone moving in now, the town offers a stable, predictable community with deep historical roots, low crime, and a conservative social fabric, but little racial or cultural diversity. The neighborhoods of Historic Downtown, South Branch Valley, Railroad District, West Romney, Romney Fields, and Mill Creek Estates each carry distinct histories, but all share a common thread: they are overwhelmingly White, locally connected, and unlikely to see significant demographic change in the next generation.

* Values derived from national, state, county, city and local statistics and may differ in a specific area. Last updated: 2026-10-05T19:37:22.000Z
Narrative content on this page is AI-generated and may contain mistakes. Verify any details that matter before acting on them.
ReloMaps may earn a commission from affiliate links at no extra cost to you.

